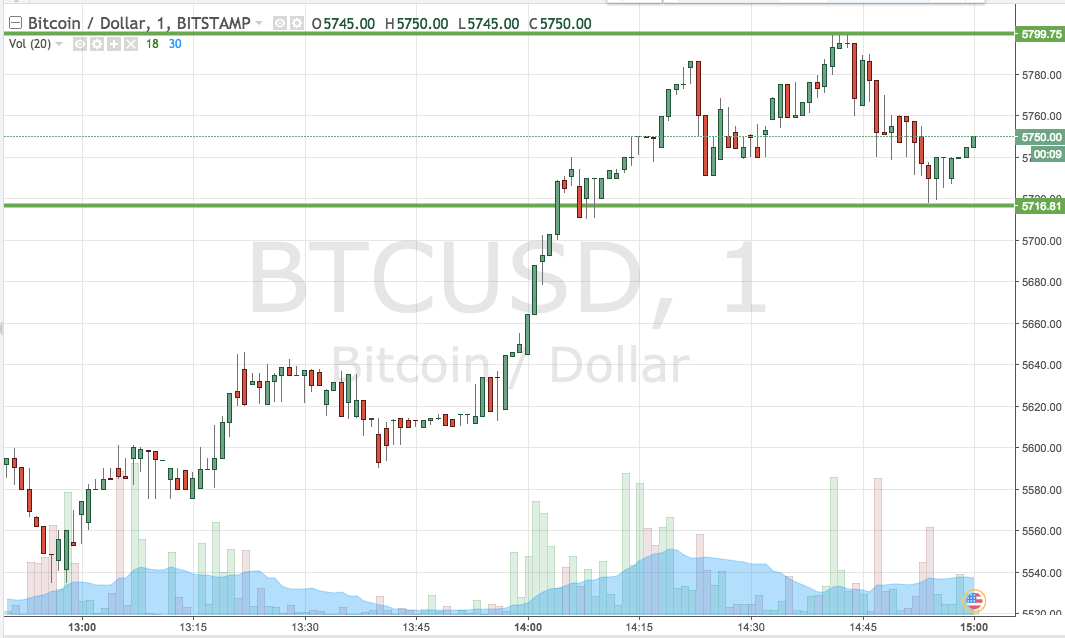
In this morning’s analysis, we noted that the bitcoin price had run up considerably over the last 24 hours and that there was a chance we may see some degree of correction near term. We are now heading into the close of the European session (and the close of the week) and, while we haven’t seen anything substantial in terms of corrective activity, we have seen price consolidate somewhat and settle down in and around the 5750 region.
There are two ways this could go.
We may see a breakout to the upside and momentum carried through towards 6000. Alternatively, price could correct and break to the downside, at which point we would likely see a breakthrough 5700 and maybe a little bit of follow-through as the evening matures.
Whichever way things go, we are going to ensure that we are on top of the markets so that we can pull a profit from action one way or another.
So, with that noted, let’s get some levels in place that we can use if we see any volatility throughout the session going forward. It is a one-minute candlestick chart and its got our key range overlaid in green.

As the chart shows, the range we are looking at for the session this evening comes in as defined by support to the downside at 5716 and resistance to upside at 5799.
If we see price break through resistance, we will look for a close above that level to validate upside entry towards a target of 5860. A stop loss on the trade at 5785 looks good.
Conversely, and looking to the downside, if we get a close below support we will jump into the markets for a short trade towards an immediate downside target of 5660. A stop loss on this one somewhere in the region of 5730 should work well.
Chart courtesy of Trading View


