It’s time to put together the first of our twice daily bitcoin price watch pieces, and in what looks to be a stark contrast to the action we saw over the last week or so, things have been pretty flat overnight. Price reached highs of a little over $725 across the major exchanges early this week (as most reading will already be aware) but has since corrected to where it currently trades, circa 670-680, and looks as though it might maintain this level for a sustained period going forward. Exactly how long this might be the case remains unclear – the short term volatility seen over the last few days has made it difficult to forecast with any real accuracy what might happen in the circa 24-48-hour range.
With this said, we can set up either side of the market and go at price in both directions, based on which way things move. So, as we move into a fresh day’s trading in the bitcoin price, and as the European session comes into full swing, here’s a look at what we are focusing on for today’s session, and a description of how we are going to get in and out of the markets according to our intraday strategy going forward.
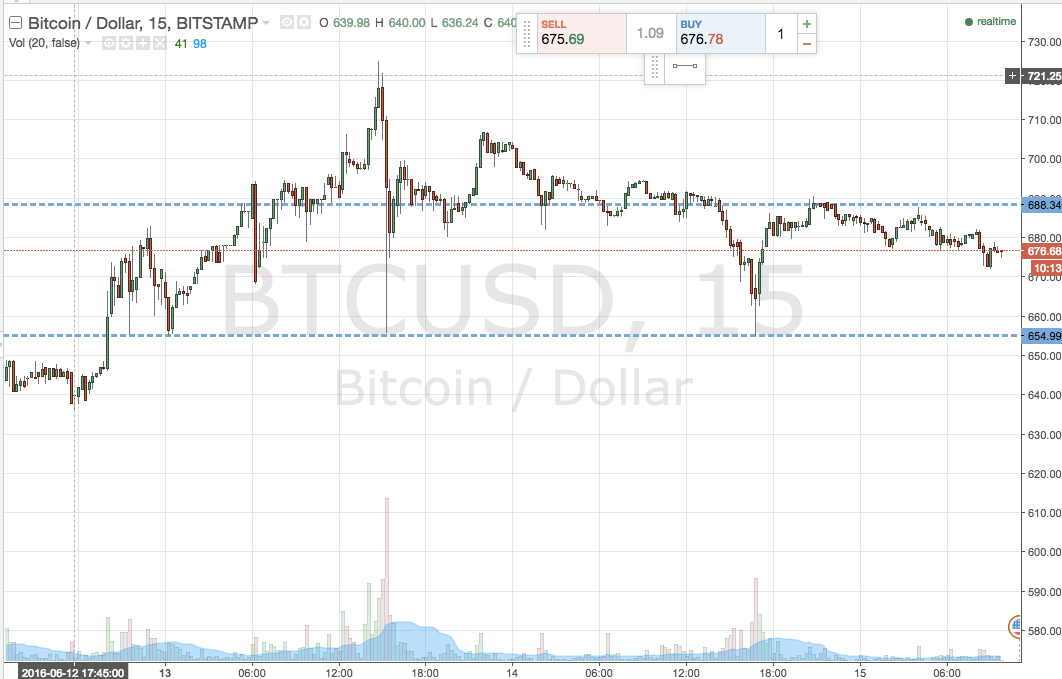
As ever, take a quick look at the chart below to get an idea of the main levels in focus.

As the chart shows, the levels we are looking to trade today are in term support at 654 to the downside (defining the bottom limit of our range) and in term resistance to the upside at 688 flat (bringing in the top end to our range).
For our breakout intraday, a close above resistance will signal a long entry towards an upside target of 700 flat. A close below support signals short towards 645.
Charts courtesy of Trading View


