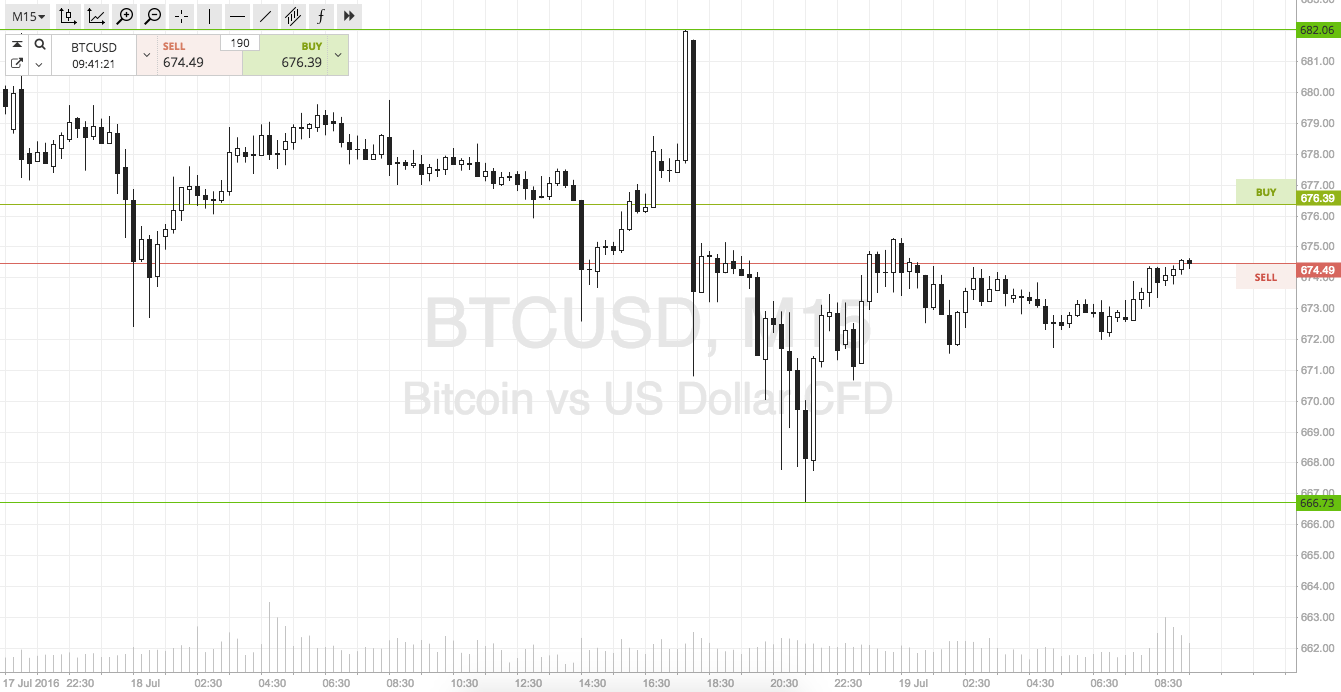
For this morning’s analysis, we’re going to shift back to the fifteen minute charts from the five, just so as we can get a little bit of perspective on the bitcoin price action seen last night. Over the last few days, things have been relatively active, and during yesterday’s session we got taken out of a trade on a stop loss hit primarily as a result of this activeness, but overnight things seem to have settled down a little. Price initially broke to the downside shortly after we published our analysis, but not enough to get us in and out of the markets, but having carved out overnight lows somewhere around 666 (which we will come back to shortly) has since traded pretty flat.
With any luck, we will see this sideways momentum translate into something a little more volatile before the session closes and give us something to go at from a breakout perspective.
So, with this in mind, as as we get going on a fresh session this morning, here’s a look at what we are focusing on in today’s bitcoin price market. Take a quick look at the chart below to get an idea of what we’re focusing on before we get started with the analysis.

As the chart shows, the levels in focus for today’s morning session out of Europe are in term support at the above mentioned 666 and in term resistance to the upside at 682. There’s plenty of room for an intrarange approach, so the usual long on a bounce from support and short on a correction from resistance.
If price closes above resistance, we will look to get in a long position towards an initial upside target of 690. Looking the other way, a close below support will signal short towards 652. Stops just the other side of the key levels in both instances to manage risk on the positions.
Charts courtesy of SimpleFX


