So we’re heading into a fresh week’s worth of trading in the bitcoin price, and it’s looking like we are set up for another interesting run. Things were pretty volatile last week, and we managed to get in and out of the markets according to our standard intraday strategy on a number of occasions for a nice scalp profit. Of course, we got stopped out of a few trades as well, but the outcome was a net gain on the markets, so things are pretty solid as things stand.
So what happened today, and where are we going to look to get in and out of the markets according to our strategy this evening? We’ve got the rest of the evening in the US to play with, and beyond that, the Asian session leading into early morning Europe.
Let’s get to the detail.
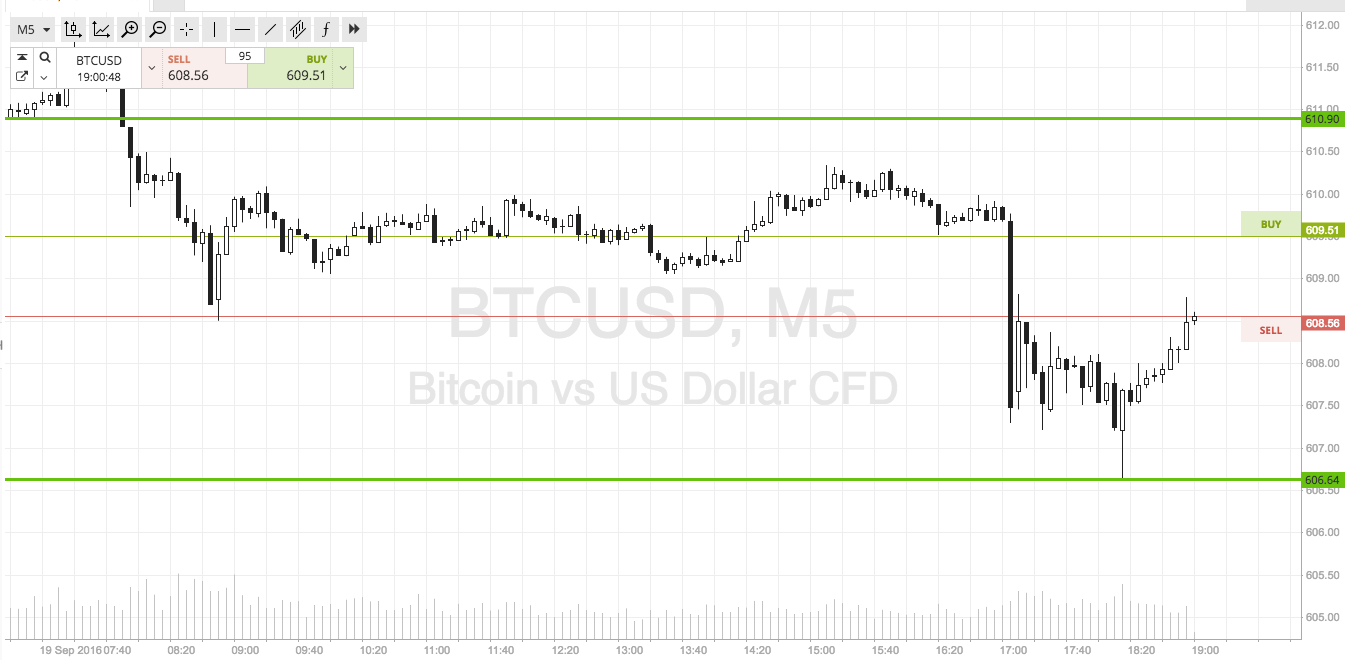
As ever, take a look at the chart below to get an idea of the levels in focus. It’s an intraday five-minute chart with our target levels overlaid in green, and it shows the last twelve hours’ worth of action (the European session on Monday).

As the chart shows, we are looking at a range defined by in term support to the downside at 606, and in term resistance to the upside at 611 flat. This rage is not quite wide enough to go at things from an intrarange perspective, so not for the first time this month, we are targeting just a breakout scalp approach.
If price breaks below support, we will look to get in short towards an immediate downside target of 600 flat. A stop loss at 606 keeps risk tight.
Conversely, if price breaks above resistance, we will get in long towards 616 flat. Again we need a stop, and 6009 looks good.
Happy Trading!
Charts courtesy of SimpleFX


