So the markets have now drawn to a close out of Europe, and it’s time to take our second look of the day at the bitcoin price. In this morning’s analysis, we focused on action over the last few days, and noted that the bullish run in price may be sustainable, and that we should see an influx of volume into the markets today on the back of the return to business in the US. We also made a side note of pointing out that the next three months are generally some of the busiest in the traditional financial asset markets, and base don the few of years’ worth of volume data we have on the bitcoin space, cryptocurrency is no different. As such, after what has been a pretty stagnant summer, we are expecting a high volume, high volatility close to this quarter and the same heading into the next.
This is great for us, of course, as we are breakout traders. Breakout traders love volatility and – even better – love it when that volatility has enough volume behind it to translate into a sustainable move.
That’s for the future, however.
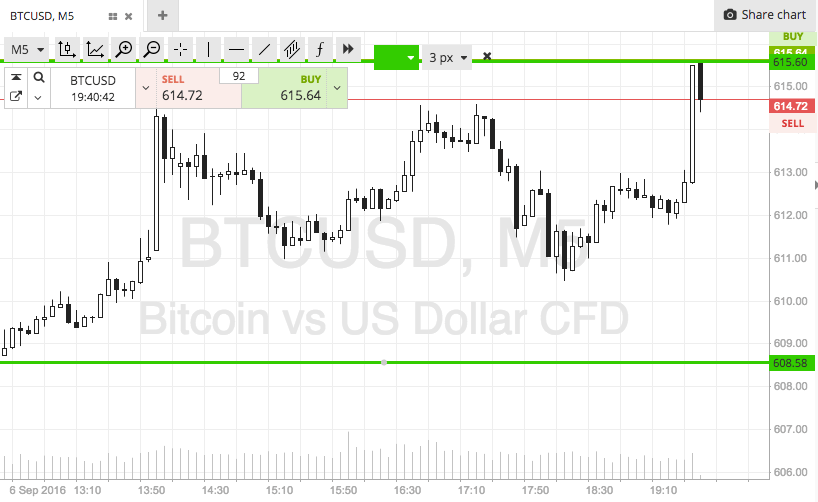
For now, let’s focus on what’s happening on the intraday charts, and see if we can pull some short term profits from the market with our traditional intraday scalp strategy. As ever, take a look at the chart below to get an idea what’s on this evening. It’s a five-minute candlestick chart showing the last twelve hours or so worth of action, and it has our range in focus overlaid in green.

As the chart shows, the range we are focusing on this evening is defined by in term support to the downside at 608 and in term resistance to the upside at 615. These two levels define our range, and will also define our risk parameters as we get in and out of the markets this evening.
So, specifically. If price breaks through in term support we will look to enter short towards an immediate downside target of 600 flat. Conversely, a close above resistance will signal long towards 622 to the upside. Stops just the other side of the entries define risk on each position.
Happy Trading!
Charts courtesy of SimpleFX


