In this morning’s analysis, we covered the recent action that we’d seen in the bitcoin price and highlighted the potential for a $3000 level break. Price was looking strong and – on the back of the action we saw over the weekend – it looked as though we may see a continuation of this strength as the European session matured.
As it turns out, things went the other way.
The bitcoin price currently stands in and around the 2750 mark, 250 points off our 3000 target and looking, for all intents and purposes, like it might weaken further as the European session draws to a close and the US session gets underway.
As we always say, it doesn’t really matter which way price moves (at least, that is, from a short term trading perspective). Our strategy is set up to allow us to profit from action in both directions, so as long as price moves (that’s the key to our successful implementation – movement) then we can get in and ride out to profit.
Anyway, enough rambling.
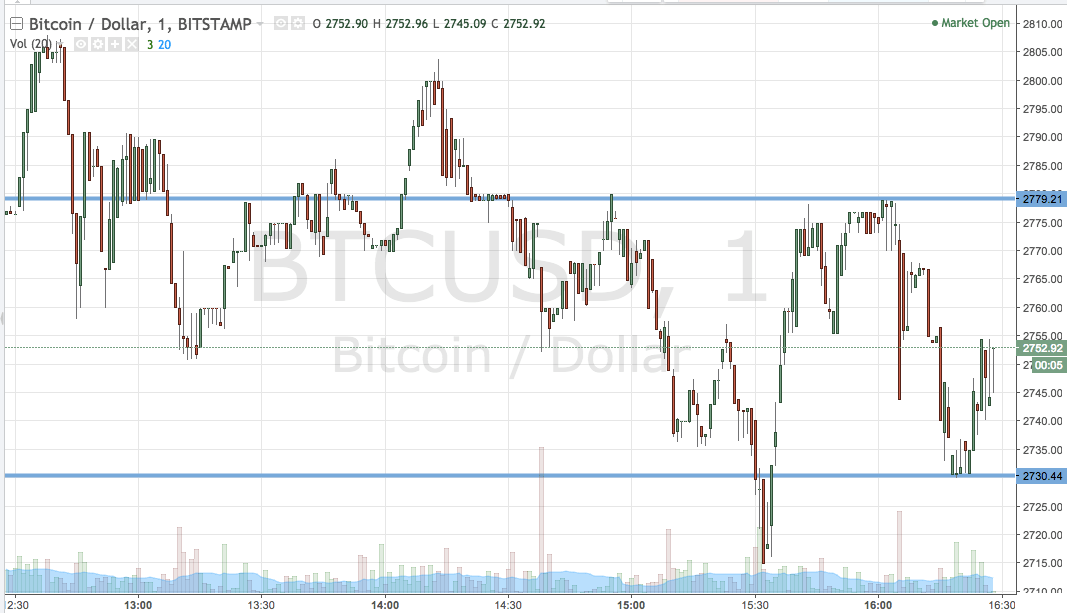
Let’s get to the key levels for the session today. As ever, take a quick look at the chart below to get an idea of what’s on and where things stand for the session going forward. It’s a one-minute candlestick chart and our range is overlaid in blue.

As the chart shows, then, the range we are going at for the session this evening is defined by support to the downside at 2730 and resistance to the upside at 2779. If we see a break above resistance, a close subsequent to the break will have us in long towards 2800. A stop at 2770 defines risk.
Looking short, a close below support will have us in towards 2700. A stop on this one at 2740 works well.
Let’s see what happens.
Charts courtesy of Trading View


