So the end of the week is here, and it’s time to take a penultimate look at the bitcoin price market before we kick off the weekend. Price has been pretty volatile across the last few days, and with this volatility has come plenty of opportunity to get in and out of the markets according to our intraday strategy. Overnight last night, however, things settled down a little, and we are heading into today’s European session on some relatively low volume.
This doesn’t mean there’s nothing to go at – we saw a spike a little earlier today and this spike has carved out a pretty nice range (after initially completing a breakout pattern), and so we know that volume, even being low, can move the markets.
Anyway, let’s move forward and get into the detail of today’s strategy.
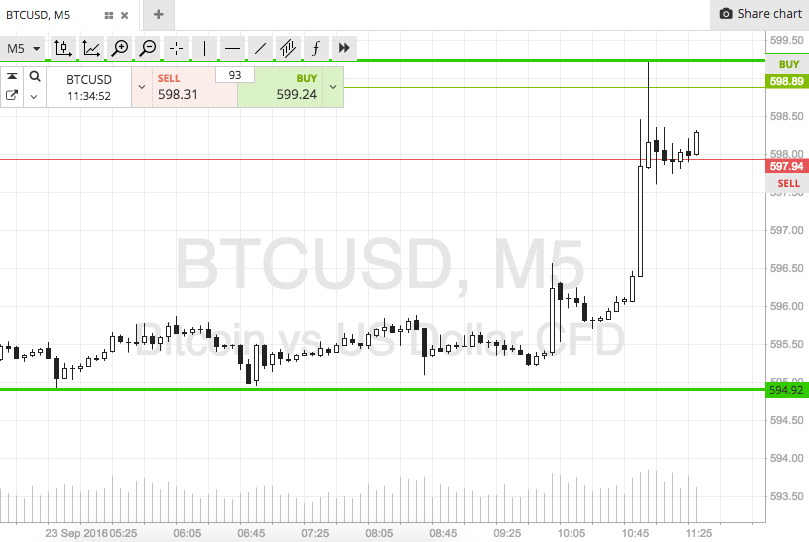
The chart below is a five-minute candlestick chart showing the overnight flat action, and also illustrating the above mentioned breakout and spike into current prices. It’s got our range overlaid in green. As ever, take a quick look at that before we get started, to get an idea of our key range in focus.

As the chart shows, the range we are looking at is defined by in term support to the downside at 594 flat, and in term resistance to the upside at 599.
We will initially look for a continuation of the current bullish momentum to break above, and close above, resistance. If we get this break, we’ll get in long towards an immediate upside target of 607. A stop loss on this position somewhere in the region of 596 works to keep risk pretty tight.
Looking the other way, a close below support will signal a short entry with a downside target of 587. A stop on this one at 596 looks good.
Charts courtesy of SimpleFX


