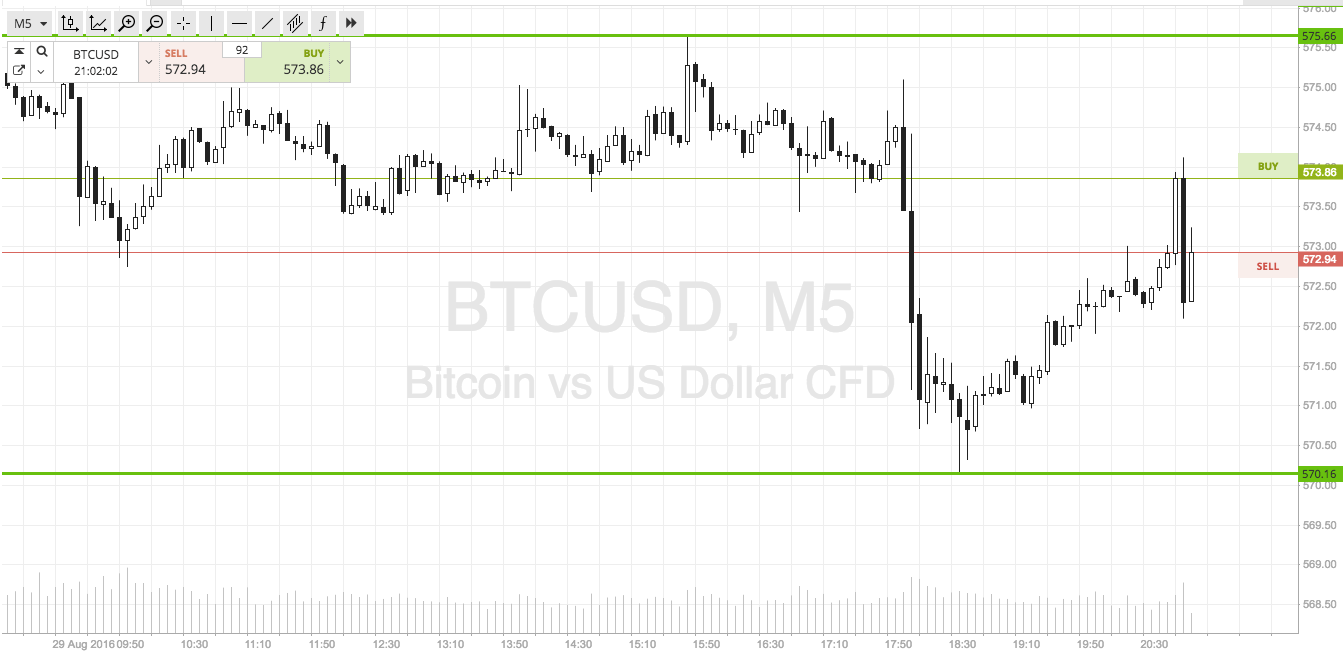
It’s been a rough day to be an intraday bitcoin price trader. In this morning’s analysis, we highlighted a pretty tight range and set out some entry rules with which we would get into the markets on any volatility. We suggested that the recent action seen in the bitcoin price was conducive to a break, and that this break could come at any time during the European session, but likely later as the US session opens up for the day.
Well, we did get a break, and a bit of volatility, later on in the session. Unfortunately, however, it wasn’t even close to being sustained, and a reversal has literally just taken us out of our position. At the 574 stop loss marker.
Oh well.
Not to worry – we’ve got plenty of time to tip the scales, it’s only the beginning of the week. With this in mind, and putting our stop hit behind us, let’s take a look at shifting things around and reevaluating. The chart below is our revised range, with a couple of key levels highlighted on the five-minute intraday chart. Take a quick look at that before we get going.

So, as the chart shows, the range in focus is defined by in term support to the downside at 570 flat and in term resistance to the upside at 575. As was the case throughout the majority of last week, the range is too tight for an effective intrarange strategy, so we’ll be looking primarily at breakout near term.
If price can close above resistance, we will look to get in long towards an immediate upside target of 580 flat. A stop loss on the trade somewhere in the region of 574 looks good from a risk perspective.
If price breaks and closes below support, we will enter short towards 565. A stop here at 571.5 works well.
Happy Trading!
Charts courtesy of SimpleFX


