Things aren’t exactly going as planned this week. We noted at the beginning of the week that we would be pretty surprised if we saw price break below the 1100 mark. We based this on the idea that longer term support should hold at that level, and that there would be enough friction to the downside to solidify it as a key level. Well, while this suggestion hasn’t yet been invalidated by action in the bitcoin price, it looks as though it’s about to be tested.
Price has declined pretty fast over the last day or two, and we currently trade somewhere in and around the 1115 level. We’re going to set up a range with which to go at price short term that uses this level, but we’ve also got one eye on the 1100 flat mark to the downside if and when we get a break and a subsequent test.
So, as we move forward, then, let’s get some levels outlined, and see what we can bring to the table.
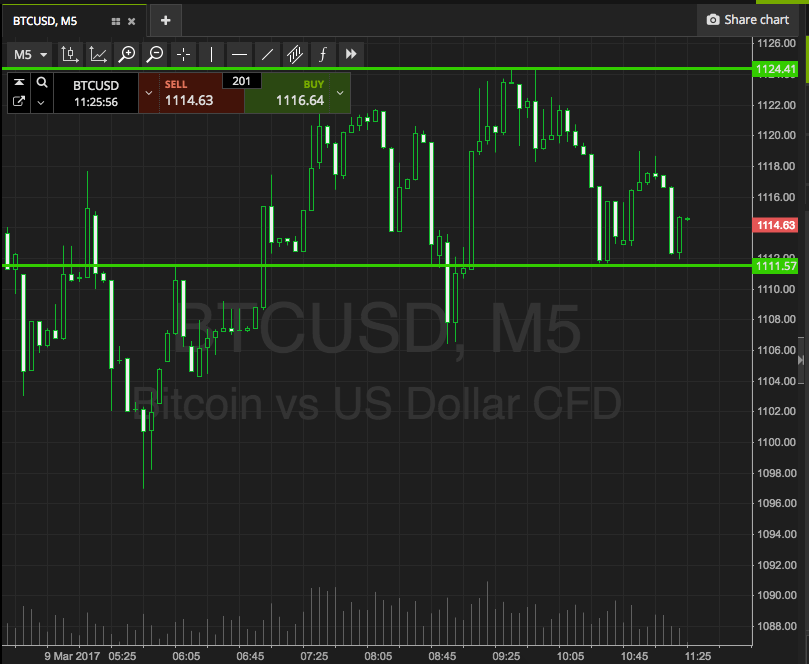
As ever, take a quick look at the chart below to get an idea of what’s on, and where things stand right now in the bitcoin price and – by proxy – with our intraday strategy. As ever, it’s a five-minute candlestick chart and it’s got our key range overlaid in green.

So, here goes.
The range defined by the chart is support at 1111 and resistance at 1124. Just about enough range to go at price with an intrarange strategy here, so long at support, short at resistance – the usual risk and targets.
From a breakout perspective, a close below support will get us in short towards a downside target of 1100. Conversely, a close above resistance will signal a long entry towards an upside target of 1135.
Let’s see how things play out.
Charts courtesy of SimpleFX


