In our bitcoin price analysis last night, we noted that the action we had seen during the session on Wednesday was conducive to some corrective momentum and that there was a strong chance that, very near term, we would see price turnaround and stage something of a recovery. We suggested that the most likely level at which this would occur was 5200, given that this level had served as both strong resistance and support relatively recently and that we expected plenty of orders to be ready to go in and around this level.
Turns out we were pretty much on the money.
Price dipped into the early evening but then, as the European session kicked off this morning, recovered quickly and just recorded fresh intraday highs in around 5730.
Things are currently trading a little below this level right now, with current price sitting just shy of 5700, but this small correction is likely just a bit of consolidation ahead of a long-term return to the overarching upside momentum.
So, with this noted, let’s get some levels in place that we can use to try and draw profit from any action we see during the session today.
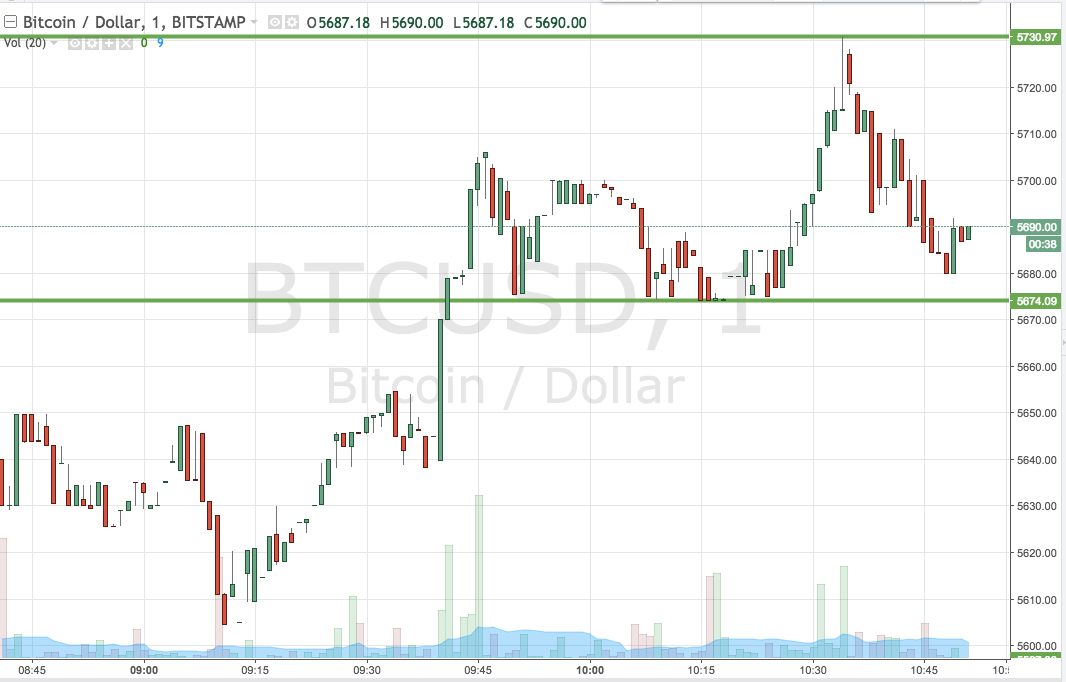
As ever, take a quick look at the chart below before we get started so as to get an idea where things stand and where we are looking to jump in and out of the markets according to the rules of our intraday strategy. It is a one-minute candlestick chart and it has our key range overlaid in green.

As the chart shows, the range we are looking at this evening comes in as defined by support to the downside at 5674 and resistance to the upside at 5730.
A close above resistance will signal long towards 5765. Conversely, a close below support will have us in short towards a downside target of 5630.
Charts courtesy of Trading View


