The middle of the week is here, and it’s gone pretty fast at this end. The bitcoin price has given us plenty to go at on a small scale, but not a whole lot to go at from a sustained momentum point of view. This has resulted in some pretty quick in-out trades – something that we can’t say is a bad thin (a positive trade is a positive trade, after all) but it gets a little frustrating sometimes.
Anyway, it’s not something we are going to dwell on.
If the bitcoin price decides it wants to move, it will move. If not, then we’ve just got to accommodate the short term action until it plays out that something new happens, and see where we go when it does.
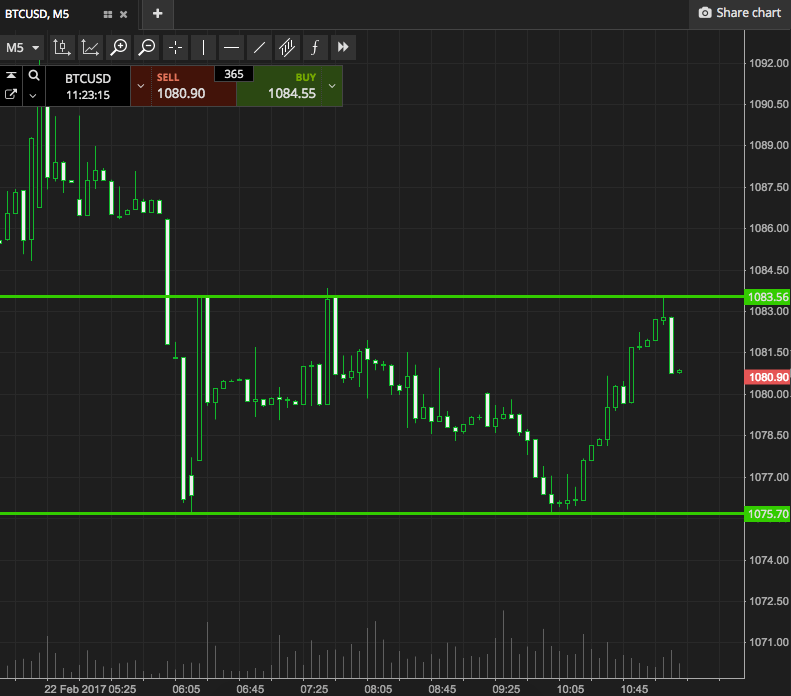
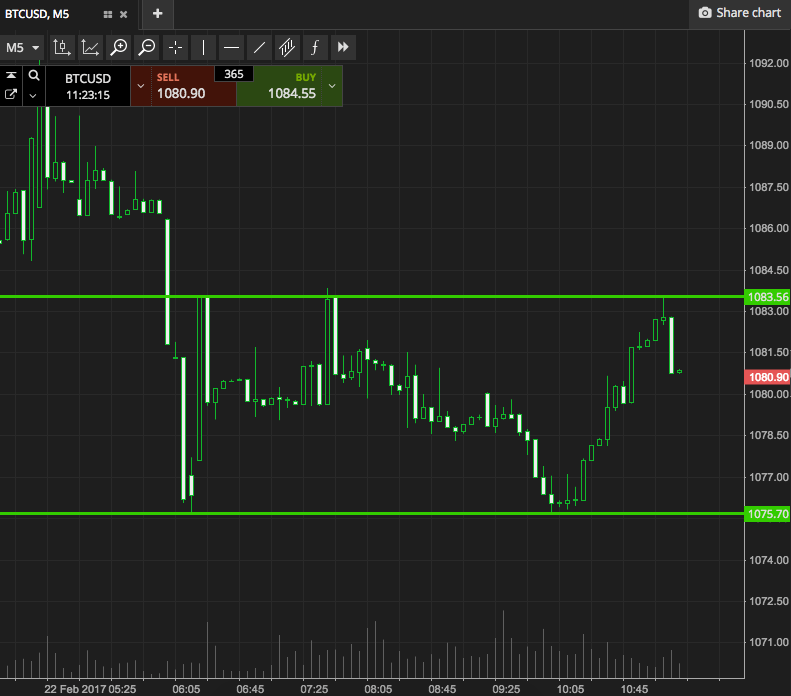
So, moving into today’s European session, let’s take a look at what we are focusing on, and where we aim to get in and out of the markets according to the rules of our intraday strategy. As we say every day, before we get started, take a look at the chart below to get an idea of what’s on, and where we stand in terms of range, price and momentum.
We’re going with our standard range here, so it’s a five-minute candlestick chart, and it’s got our key levels overlaid in green.

As the chart shows, the range in focus for the session is defined by support to the downside at 1075, and resistance to the upside at 1083. It’s pretty tight again, so we’ll need some tight stops on the entries if they activate.
On that note, if price breaks above resistance, we’ll be in long towards an immediate upside target of 1090. Short trade, short stop. Conversely, a close below support will signal an entry towards 1066.
Let’s see how things play out with these levels, and go from there.
Charts courtesy of SimpleFX


