It’s Tuesday morning out of Europe, and time to take our first look of the day at the bitcoin price. We noted yesterday that tight, scalp breakout trades had been working pretty well for us over the last few days, and that a continuation of this strategy might be our best bet going forward. As such, for last night’s session, we defined a pretty tight range and went at action with some solid risk definitions. Action has now matured overnight, and we’ve got to alter our approach slightly in ahead of today’s open. Alter, that is, from a key level perspective. Price remains pretty tight on the higher timeframes, and even though we are getting some action intraday, there’s not a lot of room to maneuver. Because of this, we need to stick with breakout scalps, and just alter our range location to accommodate what we saw yesterday evening.
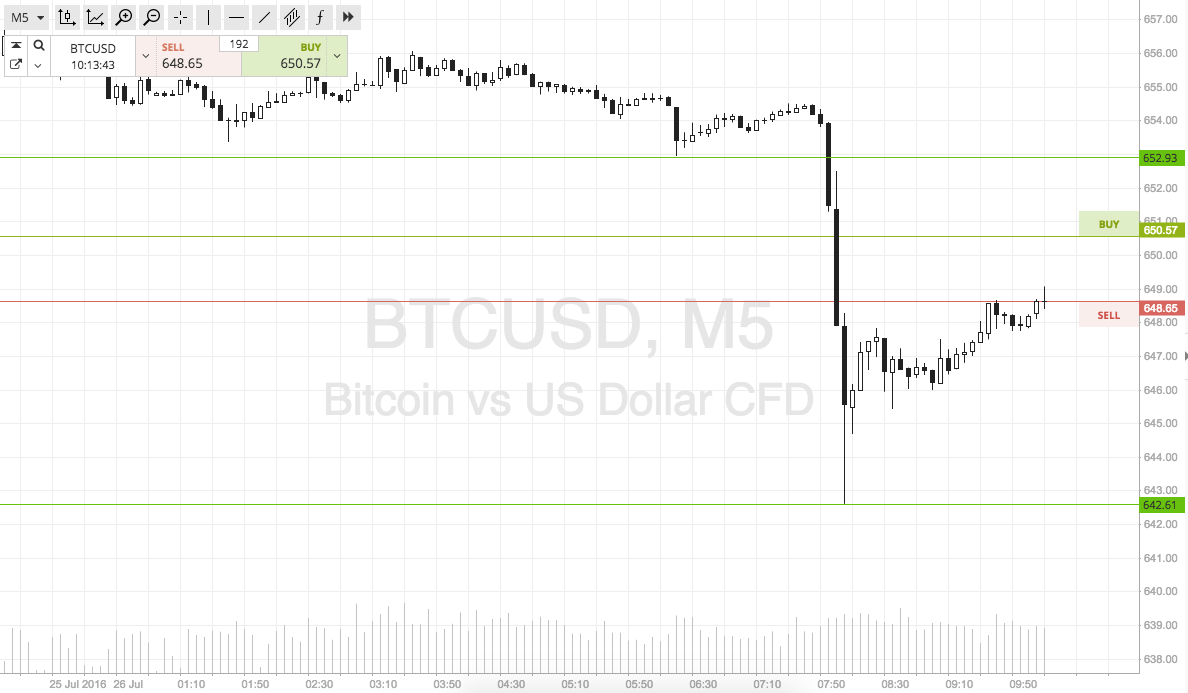
So, with this said, here’s what we are going for. As ever, take a quick look at the chart below to get an idea of the key levels for this morning. It’s a five-minute candlestick chart showing last night’s action and with this morning’s support and resistance overlaid.

As the chart shows, we are looking at support to the downside at 642 flat, and resistance to the upside at 652. It’s a ten-dollar range essentially just accommodating the decline we saw a little earlier today.
So, if price breaks to the downside, and we see a close below support on the intraday chart, we will look to get in on a short entry towards an immediate downside target of 635. A stop loss on this one at 644 looks good.
Conversely, if price breaks and closes above resistance, it will signal a long trade towards 660 flat. Stop at 650 to define risk on the downside.
Happy trading!
Charts courtesy of SimpleFX


