We knew a correction was just around the corner in the bitcoin price having seen the exuberance of the last few days and action hasn’t disappointed us in that regard. Price dropped from in and around the $11,000 area to as low as $9,000 apiece in a matter of hours and current levels sit just ahead of $9,800.
The hope is that the recent bottom proves to be just that – a turnaround point from which sentiment can reverse and the bitcoin price can once again resume its overarching march to the upside.
All we’ve got to do is make sure that we’re ready as and when things move so as to ensure we can pull a profit from the market.
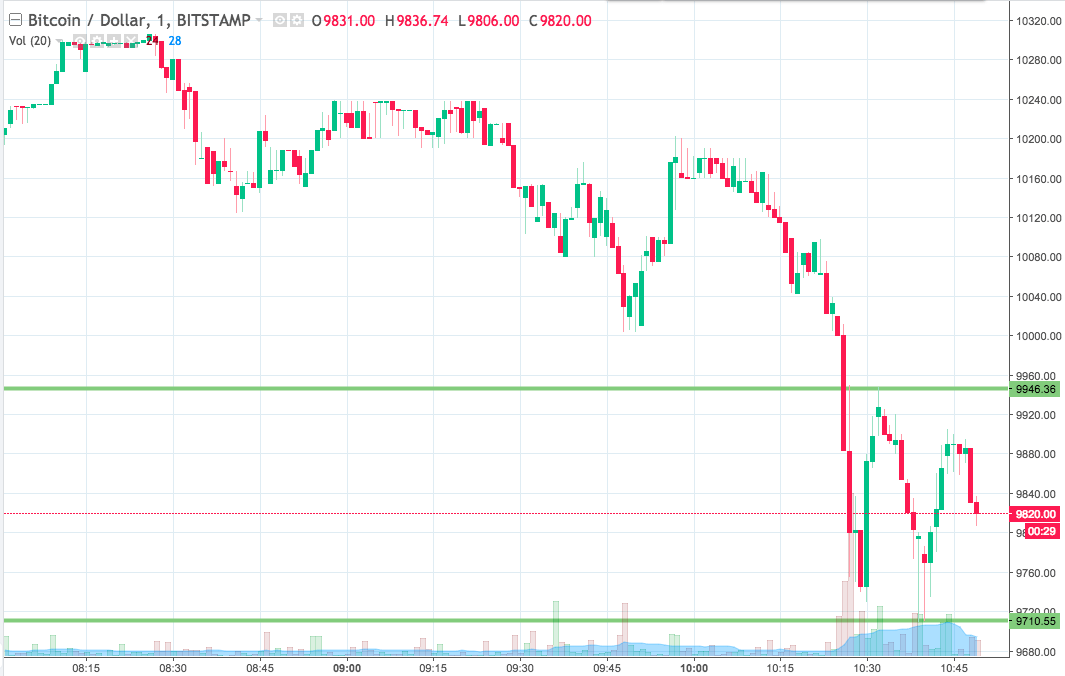
So, with this in mind, let’s get some levels in place that we can use near term. As ever, take a quick look at the chart below before we get started so as to get an idea where things stand. It’s a one-minute candlestick chart and it’s got our range overlaid in green.

As the chart shows, the range we are using for the session today comes in as defined by support to the downside at 9710 and resistance to the upside at 9946.
We’re going to be on the lookout for a close above resistance to validate an upside entry towards a target of 10000 flat. A stop loss on the position somewhere in the region of 9920 looks good from a risk management perspective.
Looking the other way, if we get a close below support, we’ll be jumping in short towards a downside target of 9670. A stop on this one somewhere in the region of 9720 will help us get out of the position if things turn around.
Let’s see how things play out from here.
Charts courtesy of Trading View


