

It’s coming to the close of the European session, and while it’s memorial day in the US (meaning wider financial markets are closed for the day) volume out of North America this afternoon looks to be on par with that seen across the last few Monday mornings. That is, at least, it’s not down considerably.
In this morning’s analysis we discussed the implications of the rally seen during the weekend, and how we could use this rally to generate a profitable strategy going forward. Specifically, we looked at a pretty wide range, and discussed how a break above or below this range would signal an entry, and that we could be a little more aggressive in our upside positions than in our downside positions, based on the current directional bias.
So, with this said, how did action fare during today’s European session, did our strategy get us into any trades, and what are we looking at as we move into the afternoon out of the US, and beyond that, into the Asian session tonight? As ever take a quick look at the chart below to get an idea of what we are focusing on. The chart below is a fifteen-minute candlestick chart, primarily showing today’s action, but also with a bit of a tail into the weekend volatility.
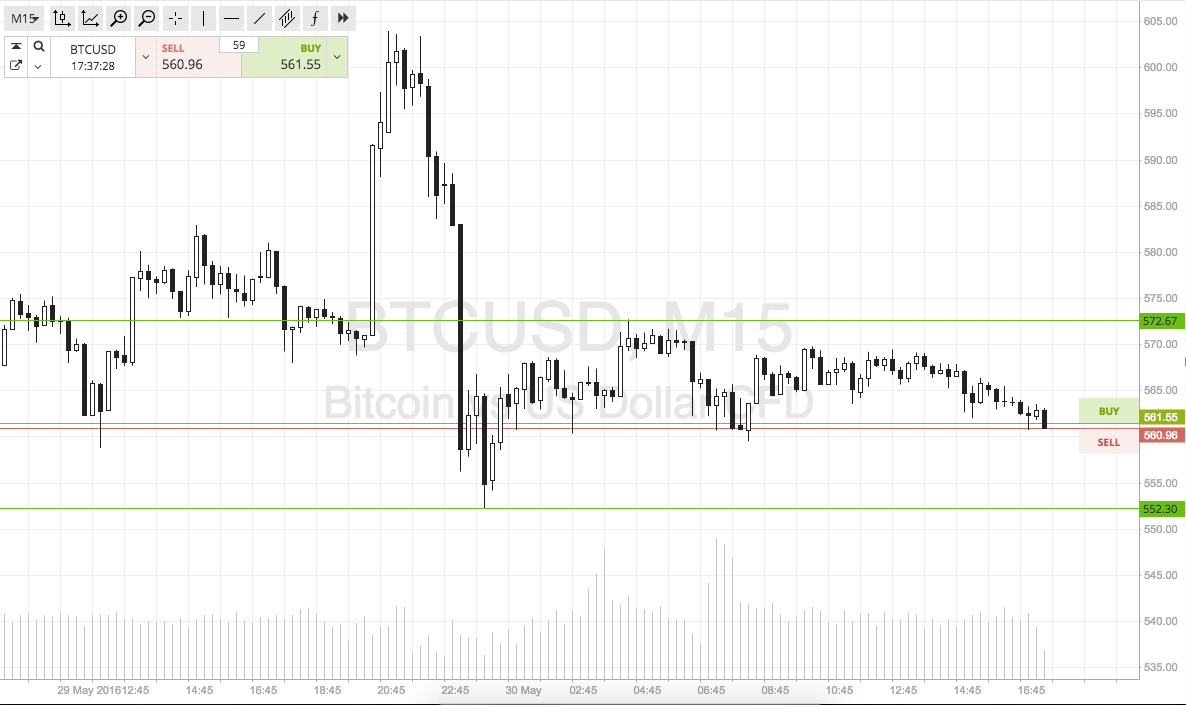

As the chart shows, after yesterday’s pop up, action throughout today’s session has been relatively flat. In light of this, we are looking at a range defined by in term support at 552 and resistance at 572. This is wider than standard, so intrarange is definitely an option. Long at support, short at resistance, target the opposing level and a stop just the other side of entry to define risk.
Looking at our breakout strategy, long on a close above resistance, short on a close below support. Targets at 582 and 542 respectively.
Charts courtesy of SimpleFX
Header Image: NewsBTC