Towards the end of last week, the bitcoin price gave back pretty much its entire early 2017 upside run. Price broke through numerous key long term levels of support, and really struggled to find any sort of traction as and when the few short term bounces came about. This makes it tough, heading into this week, to put any sort of longer term strategy together.
That said, there are some clues we can work with.
There’s a good chance that the 1000 flat level is going to pivotal if and when it breaks. If we get an upside break through that level, chances are we will see a bit of sustained momentum and a run up and through the 1020, 1030 region.
Similarly, but conversely, if price fails to break above the 1000 level and corrects from it to the downside, it’s a sign that we may be in for some near term weakness.
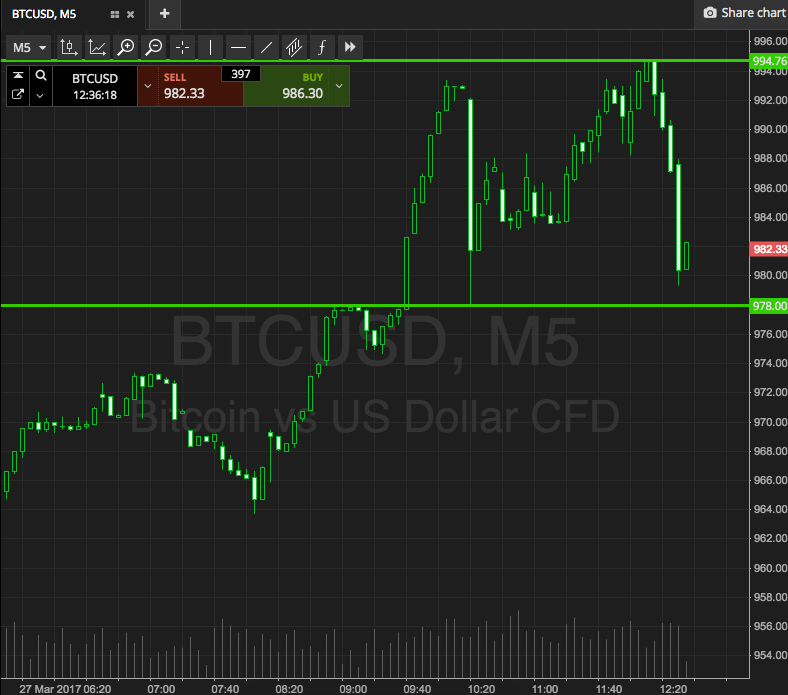
So, with this in mind, we can put some levels together for today’s session and see if we can pull a profit from the market in and around price as it stands. Take a look at the chart below to get an idea of what’s on, where price is right now, and where we are going to try and get in and out as and when price moves.

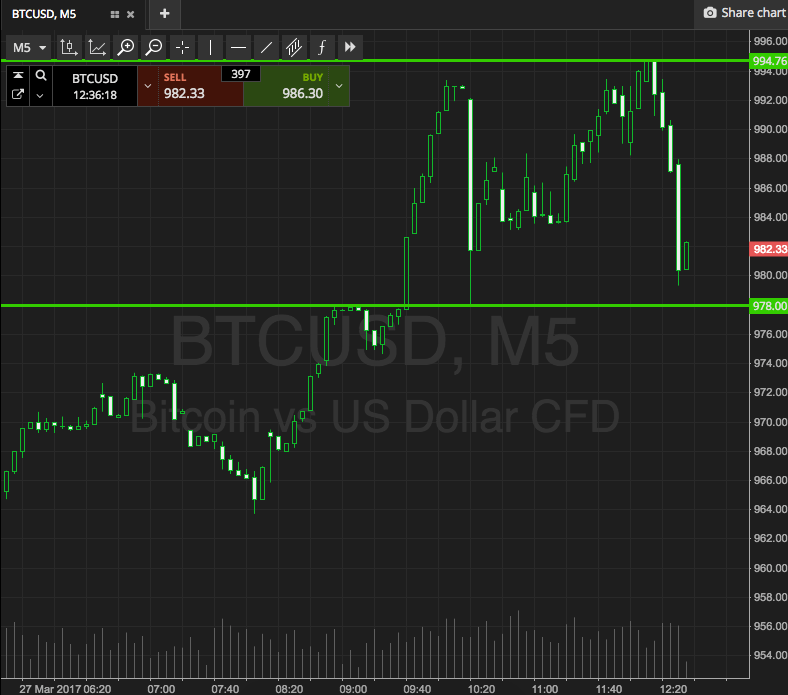
As the chart shows, the rage in focus for today is defined by support to the downside at 978 and resistance to the upside at 994.
A close below support will get us in towards 965, and a stop loss on the trade at 982 will take us out of the trade if price reverses. Looking north, a close above resistance will get us in towards 1010, but if we see a close above support we’ll enter a second trade towards the above mentioned 1020.
Charts courtesy of SimpleFX


