So at the end of last week, our primary focus was the volatility that we had seen in the bitcoin price across the previous few days. Basically, last week started out relatively flat, but then over the middle of the week, price took a dive, and closed out trading somewhere in the region of the high 900’s. We weren’t sure whether price which remain there, and that the level would hold out as support, but we set up some levels heading into the weekend anyway, and crossed our fingers. As it turns out, price did dip a little further, but eventually found support, and as we head into a fresh week worth of training this week, it looks as though we should have plenty to go at from a volatility perspective.
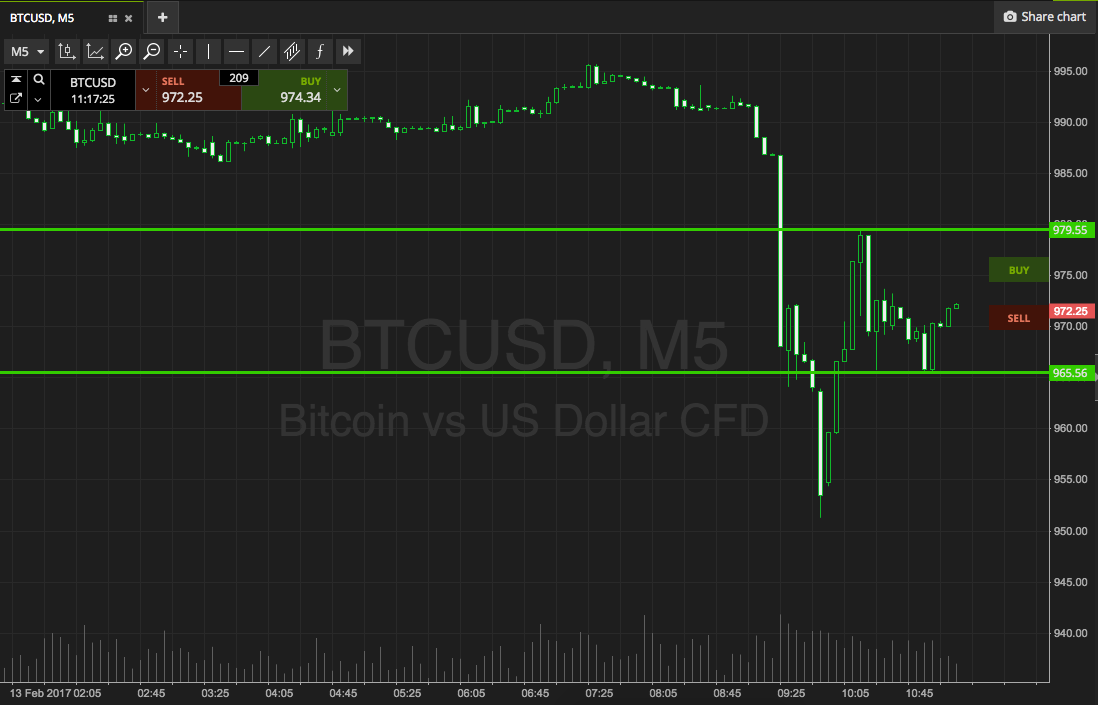
So, with this in mind, let’s outline some key levels, and try and set up against the market in order to draw a profit from any movement we see today. As ever, take a quick look at the chart below to get an idea of what we’re focusing on.

As the chart shows, the range in focus for today’s session is defined by support to the downside at 965, and resistance to the upside at 979. We are going to focus on our breakout strategy only today. Specifically, if we see price break above resistance, we will look to get in long towards an immediate upside target of 990. A stop loss on the position somewhere in the region of 975 defines risk nicely. Looking the other way, if we see price close below support, we will target an entry point of said level, and look to follow price down towards 955. Again we need a stop loss, and we are looking at 969 as acceptable on this position. Let us see how things play out moving forward.
Charts courtesy of SimpleFX


