It is time to get things kicked off for another day’s worth of trading in the bitcoin price. Overnight, we saw much of the type of action we were expecting heading into the session yesterday evening. Specifically, we were looking for some degree of breakout action followed by consolidation, as the shorter-term operators took profits off the table and closed out positions. We saw price hit highs in and around 2240, before correcting as expected and consolidating in a range between 2120 and 2200. As an aggregate focus, we are looking at this area going into the session today. We are going to work with a slightly tighter range than that outlined, but one that falls within these parameters nonetheless.
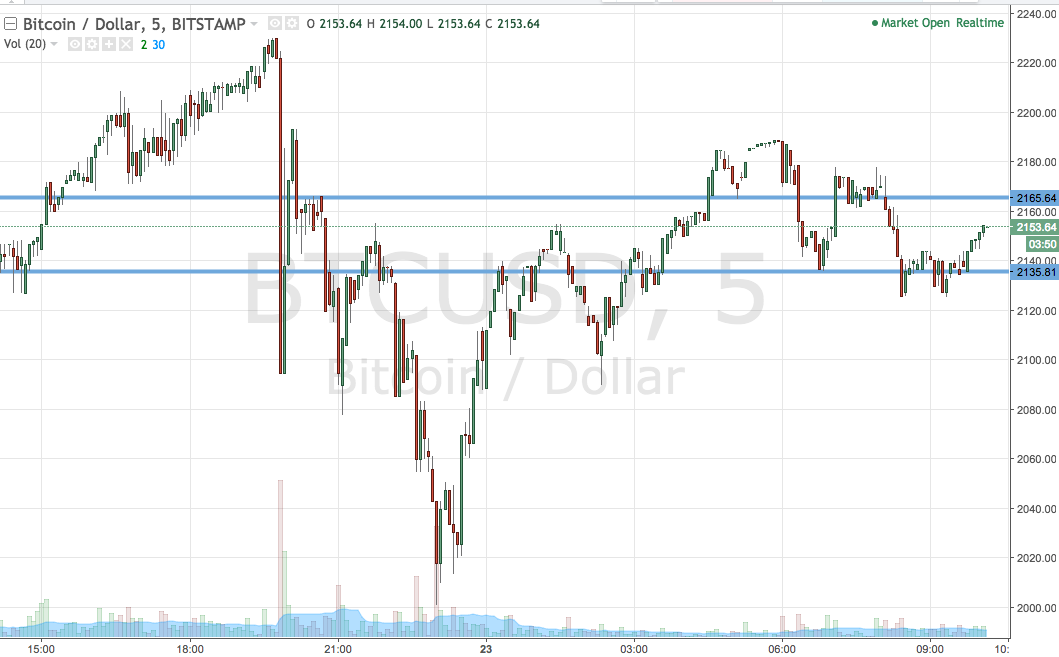
So, with this noted, and as we head into the session today, here is a look at what we are focusing on in the bitcoin price and where we intend to get in and out of the markets on any volatility. As ever, take a quick look at the chart below to get an idea of what is on. It is a five-minute candlestick chart and has our key range overlaid in green.

As the chart shows, the range we have got in our sights today is defined by support to the downside at 2135 and resistance to the upside at 2165. Just as we have been saying for a couple of days now, there is about enough room to bring an intrarange approach into play with these parameters. However, we’re going to stick to breakout for now. This is purely a risk driven decision. When we see some consolidation post-highs, it can suggest we are in for a near-term run, and we don’t want to get caught on the wrong end of one of these runs having entered a midrange position using our intrarange strategy.
Looking at our breakout approach, then, if price breaks above resistance, we will enter long towards an upside target of 2180. Conversely, a close below support will get us in towards 2120. Stop losses on both positions ensure we are taking out of the trade in the event of a bias reversal.
Charts courtesy of Trading View


