So we’ve just got one more day of the week left, and what a week it’s been. Things have been pretty volatile, and we’ve seen some real strength across the entire space from a price perspective. Exactly how things play out from here remains to be seen. As we noted last night, there’s a potential correction on the cards, and if this happens, we’re going to see a dip as traders take profits off the table and operators sell out to avoid the chop.
That said, with the breakouts we’ve seen over the last few days, there’s a decent chance that we may avoid a correction.
When all’s said and done – who knows. And as far as our intraday strategy is concerned – who cares. We can profit from action in both directions, so long as we set up our key levels, correctly, and that’s what we fully intend to do as we close out this week.
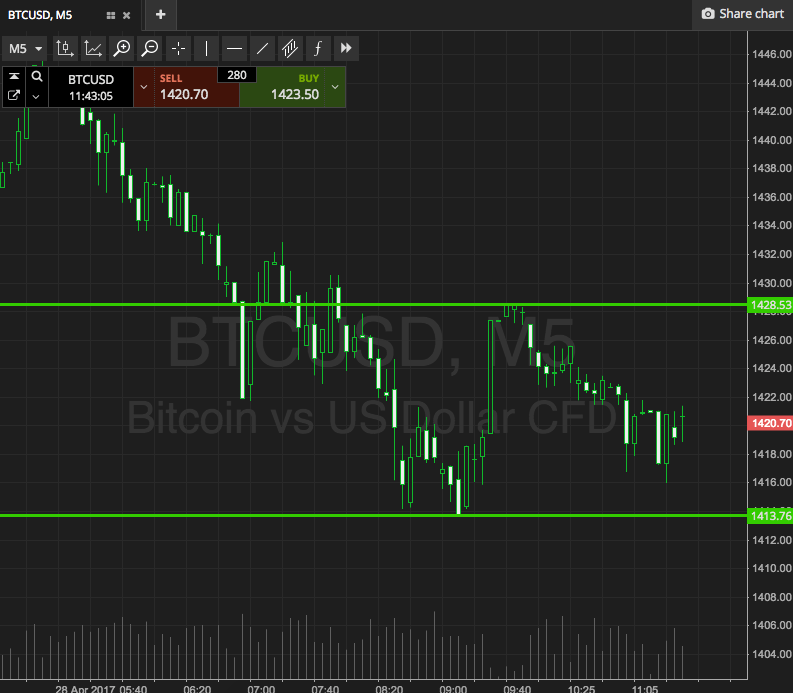
So, with this noted, let’s get moving. As ever, take a look at the chart below to get an idea what’s on, and where we’re looking to get in and out of the markets according to the rules of our intraday strategy. It’s a five-minute chart, and it’s got our key range overlaid in green.

As the chart shows, the range we’re looking at is defined by support to the downside at 1413, and resistance to the upside at 1428. We’re going to look for a close above resistance initially, as a signal for an entry towards an upside target of 1440. A stop at 1425 defines risk on the position pretty well.
Looking to the short side, if we see price break below support, a close below that level will get us in towards an immediate downside target of 1400. A stop on this one at 1416 looks good.
Charts courtesy of SimpleFX


