Here we go then. We’re closing in on the end of the week in our bitcoin price efforts and what an exciting week it’s been in the bitcoin space. Things have been pretty much entirely controlled by the bulls during the primary sessions and volume has stayed relatively steady (steadily high) throughout. If we can maintain this volume, anything could happen over the weekend. We’ve seen 1400, 1500 and now 1600 tumble and the bitcoin price is riding at all time highs.
We’re all too aware that there’s the potential for a correction on the cards. Things have run up so fast (and so sharp) that a correction is almost inevitable, and it’s just about when it comes as opposed to if it comes.
We’re going to be ready for it when it does.
For now, however, all we can really do is set up against what we see and hope things don’t get too volatile. Well, not volatile in the sense that we don’t get movement – we love movement – but volatile in the sense that things don’t collapse too quickly.
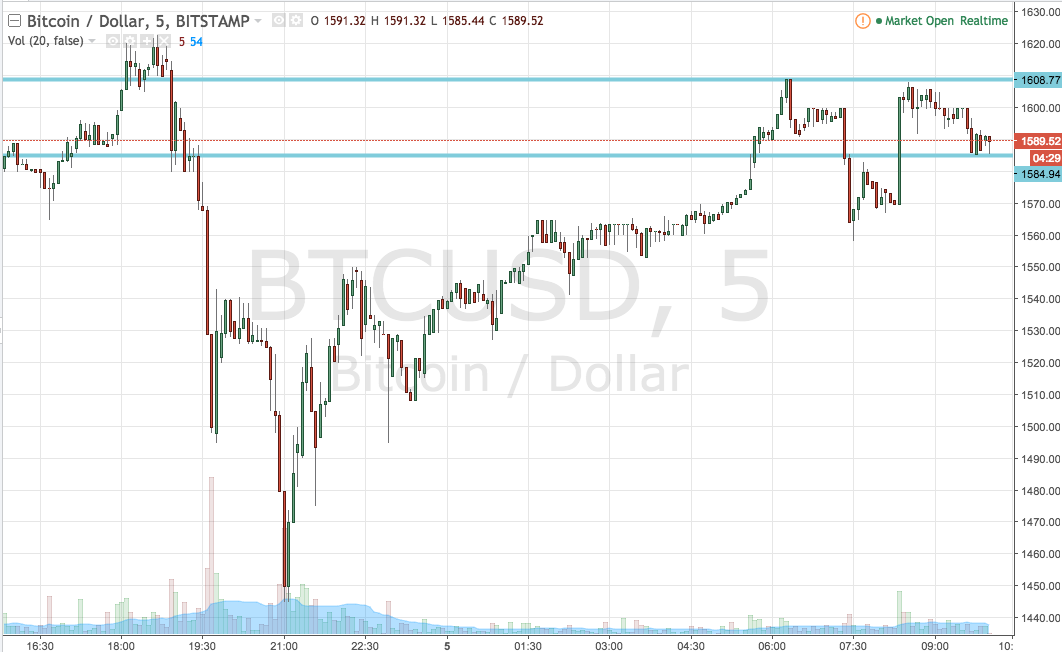
So, let’s got our key levels outlined for the session. As ever, take a quick look at the chart below to get an idea of what’s on, and where we’re looking to get in and out of the markets according to the rules of our intraday strategy as and when price moves. It’s a five-minute candlestick chart and it’s got our range overlaid in green.

As the chart shows, the range we’re going at today is defined by support to the downside at 1584 and resistance to the upside at 1608. We’re straddling the 1600 threshold.
If price breaks through resistance, we’ll be in long towards an upside target of 1620. A close below support and we’ll get in towards 1570 flat.
Let’s see how things play out.
Charts courtesy of TradingView


