Reason to trust

How Our News is Made
Strict editorial policy that focuses on accuracy, relevance, and impartiality
Ad discliamer
Morbi pretium leo et nisl aliquam mollis. Quisque arcu lorem, ultricies quis pellentesque nec, ullamcorper eu odio.
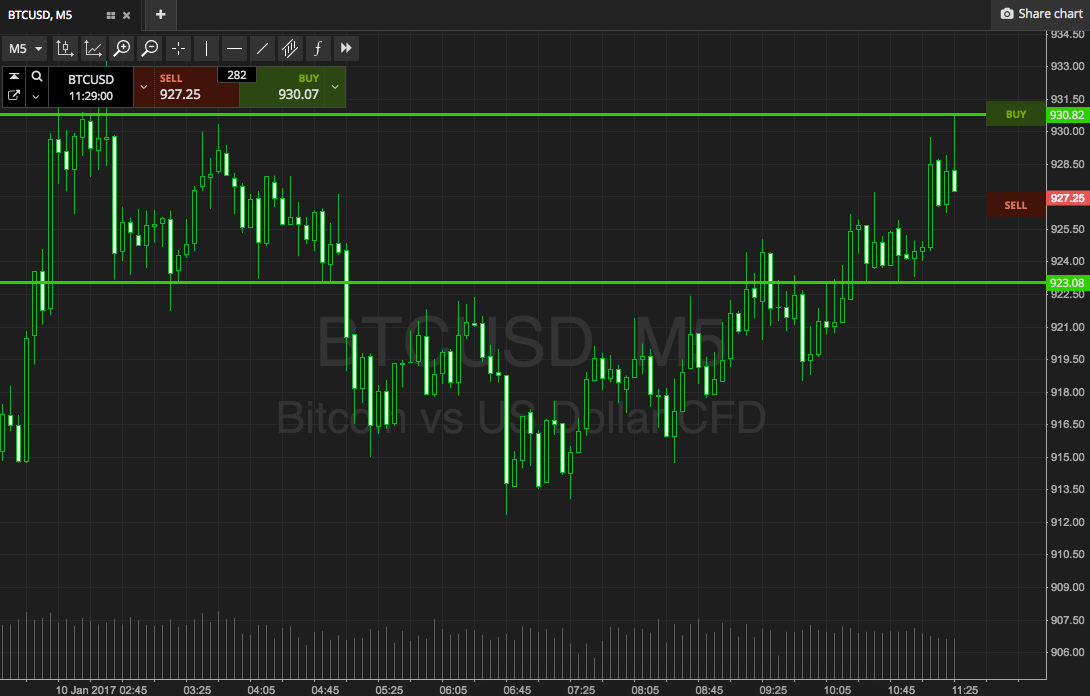
Once again, overnight, we have seen some pretty volatile action in the bitcoin price. For the last couple of weeks, this volatility has become something of the norm, and on a number of occasions, we’ve had to narrow our time frames into the one-minute chart in order to define some levels that are narrow enough for us to take advantage of our breakout strategy during the European session. This morning is one of those occasions. As you will see from the chart below, we’re using the one-minute chart, and even that is not giving us too narrow a range to play with. It means we can bring our intrarange strategy into play, so that’s one advantage, but it doesn’t make for particularly easy viewing on the screen.
Anyway, let’s get to the detail.
Take a look at the chart below to get an idea of what is on this morning. It is – as mentioned – a one-minute chart, showing the last three hours or so worth of action in the bitcoin price and it has our range overlaid in green.

As the chart shows, the range in focus is defined by support to the downside at 850 and resistance to the upside at 864. As mentioned, intrarange is on, so long on a bounce from support and short on a correction from resistance. A stop loss just the other side of the entry on both positions will ensure that – in the event than price reverses to trade against us – we are taken out of the trade for nothing more than a small, manageable loss. If price breaks through resistance, we will enter long towards 873. Conversely, a close below support will put us short towards 840. Again we need a stop loss on both trades, and two or three dollars just the other side of the entry works well.
Charts courtesy of SimpleFX


