
Reason to trust
How Our News is Made
Strict editorial policy that focuses on accuracy, relevance, and impartiality
Ad discliamer
Morbi pretium leo et nisl aliquam mollis. Quisque arcu lorem, ultricies quis pellentesque nec, ullamcorper eu odio.
Key Points
- Bitcoin price started a downside correction after climbing as high as $6,554 against the US Dollar.
- There was a break below a major bullish trend line with support at $6,420 on the 4-hours chart of the BTC/USD pair (data feed from Kraken).
- The pair is currently at a risk of more losses below the $6,300 support area in the near term.
Bitcoin price is under pressure below $6,400 against the US Dollar. BTC/USD could decline towards $6,280 or $6,250 if sellers remain in control.
Bitcoin Price Analysis
This past week, we saw a decent upward move above the $6,400 and $6,500 levels in bitcoin price against the US Dollar. The BTC/USD pair traded towards the $6,550 level and settled above the 100 simple moving average (4-hours). A fresh monthly high was formed at $6,554 and later the price corrected lower sharply. It broke the $6,500 and $6,440 support levels to move back in a bearish zone.
The price also breached the 50% Fib retracement level of the last wave from the $6,202 low to $6,554 high. More importantly, there was a break below a major bullish trend line with support at $6,420 on the 4-hours chart of the BTC/USD pair. The pair traded below the $6,360 support and the 100 simple moving average (4-hours). At the moment, the price is consolidating above $6,300. If sellers remain in action, the price could slide towards the $6,280 level and the 76.4% Fib retracement level of the last wave from the $6,202 low to $6,554 high.
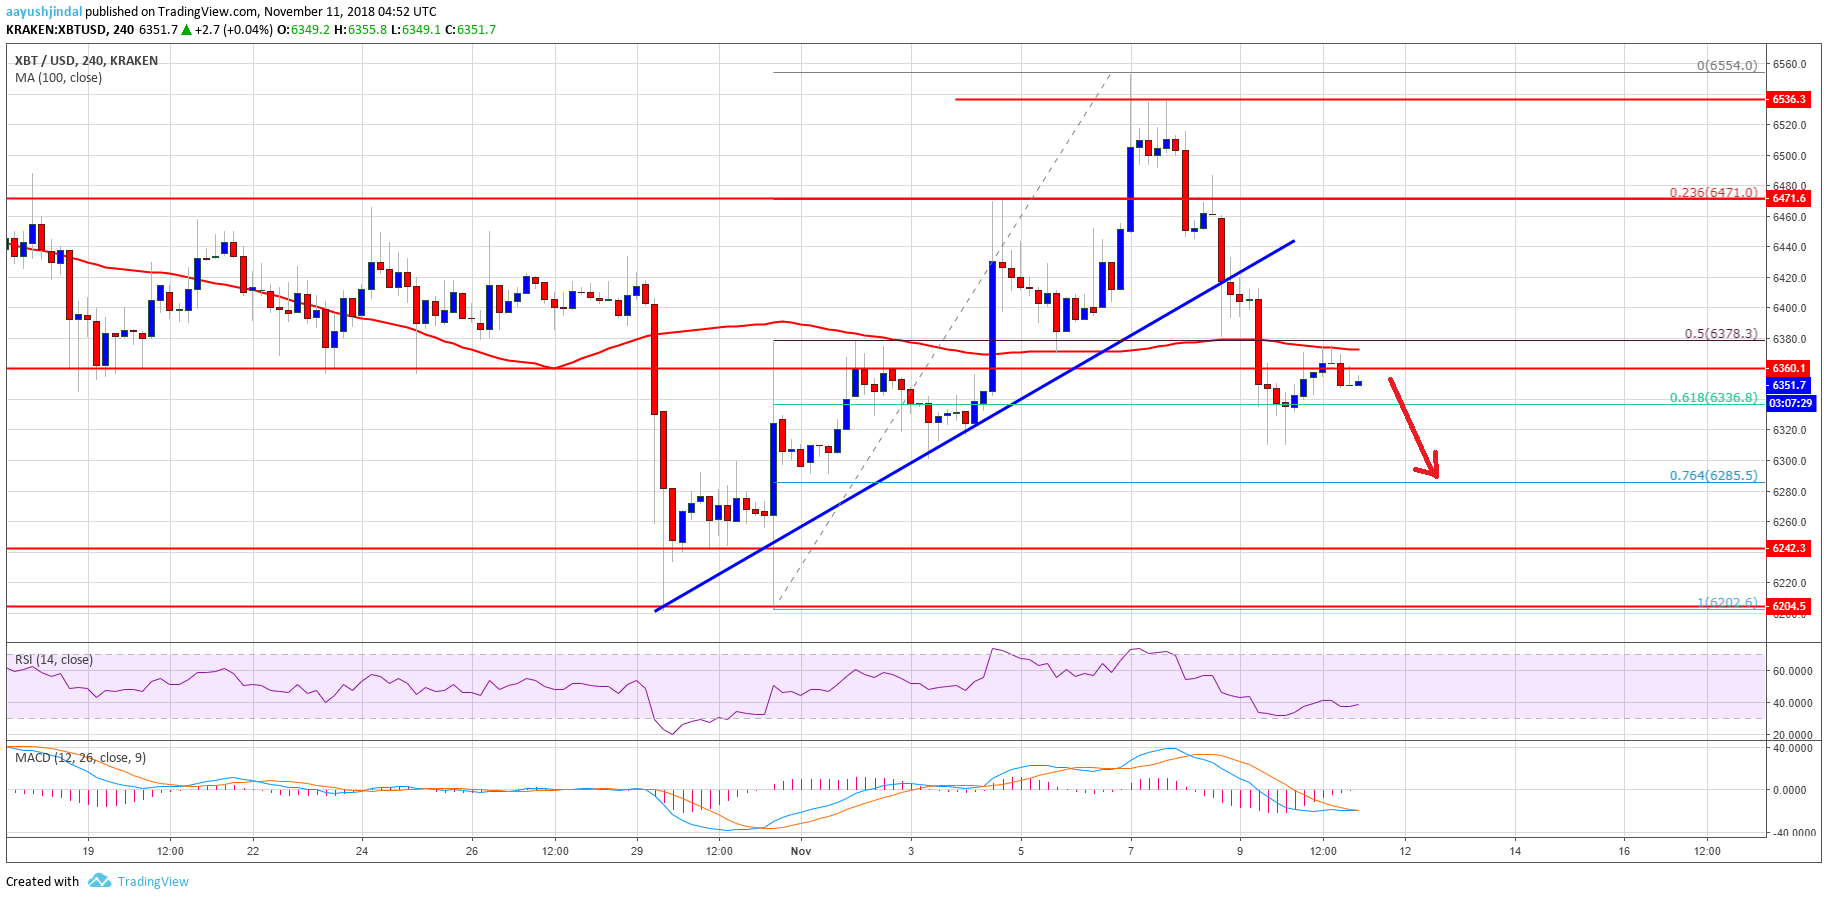
Looking at the chart, BTC price is currently struggling to break the $6,360-70 resistance zone and the 100 SMA. A successful close above $6,400 is needed for buyers to regain momentum. If not, there is a risk of a downside break below the $6,280 support in the near term.
Looking at the technical indicators:
4-hours MACD – The MACD for BTC/USD is slowly moving into the bullish zone.
4-hours RSI (Relative Strength Index) – The RSI is currently well below the 50 level.
Major Support Level – $6,250
Major Resistance Level – $6,400


