
Reason to trust
How Our News is Made
Strict editorial policy that focuses on accuracy, relevance, and impartiality
Ad discliamer
Morbi pretium leo et nisl aliquam mollis. Quisque arcu lorem, ultricies quis pellentesque nec, ullamcorper eu odio.
Key Points
- Bitcoin price traded higher and cleared the $6,580-6,600 resistance zone against the US Dollar.
- There is a key bullish trend line in place with support at $6,550 on the 4-hours chart of the BTC/USD pair (data feed from Kraken).
- The pair is currently correcting lower, but it could find support near the $6,600 and $6,550 levels.
Bitcoin price climbed above the key $6,600 resistance against the US Dollar. BTC/USD needs to clear the $6,850 level to gain upside momentum in the near term.
Bitcoin Price Analysis
This past week, bitcoin price started a decent upward move from the $6,110 support area against the US Dollar. The BTC/USD pair traded higher and broke the $6,380 and $6,500 resistances. The best thing was a close above the $6,600 resistance and the 100 simple moving average (4-hours). The price traded above the $6,700 level and tested the next resistance zone near $6,850 (the previous support).
It traded as high as $6,831 and is currently correcting lower. At present, the 23.6% Fib retracement level of the last wave from the $6,111 low to $6,831 high is acting as a support. If the price continues to correct lower, the previous resistance at $6,600 may hold losses. There is also a key bullish trend line in place with support at $6,550 on the 4-hours chart of the BTC/USD pair. Below the trend line, the 50% Fib retracement level of the last wave from the $6,111 low to $6,831 high is at $6,460. Therefore, if the price corrects lower, it could find supports near $6,600, $6,550 and $6,450.
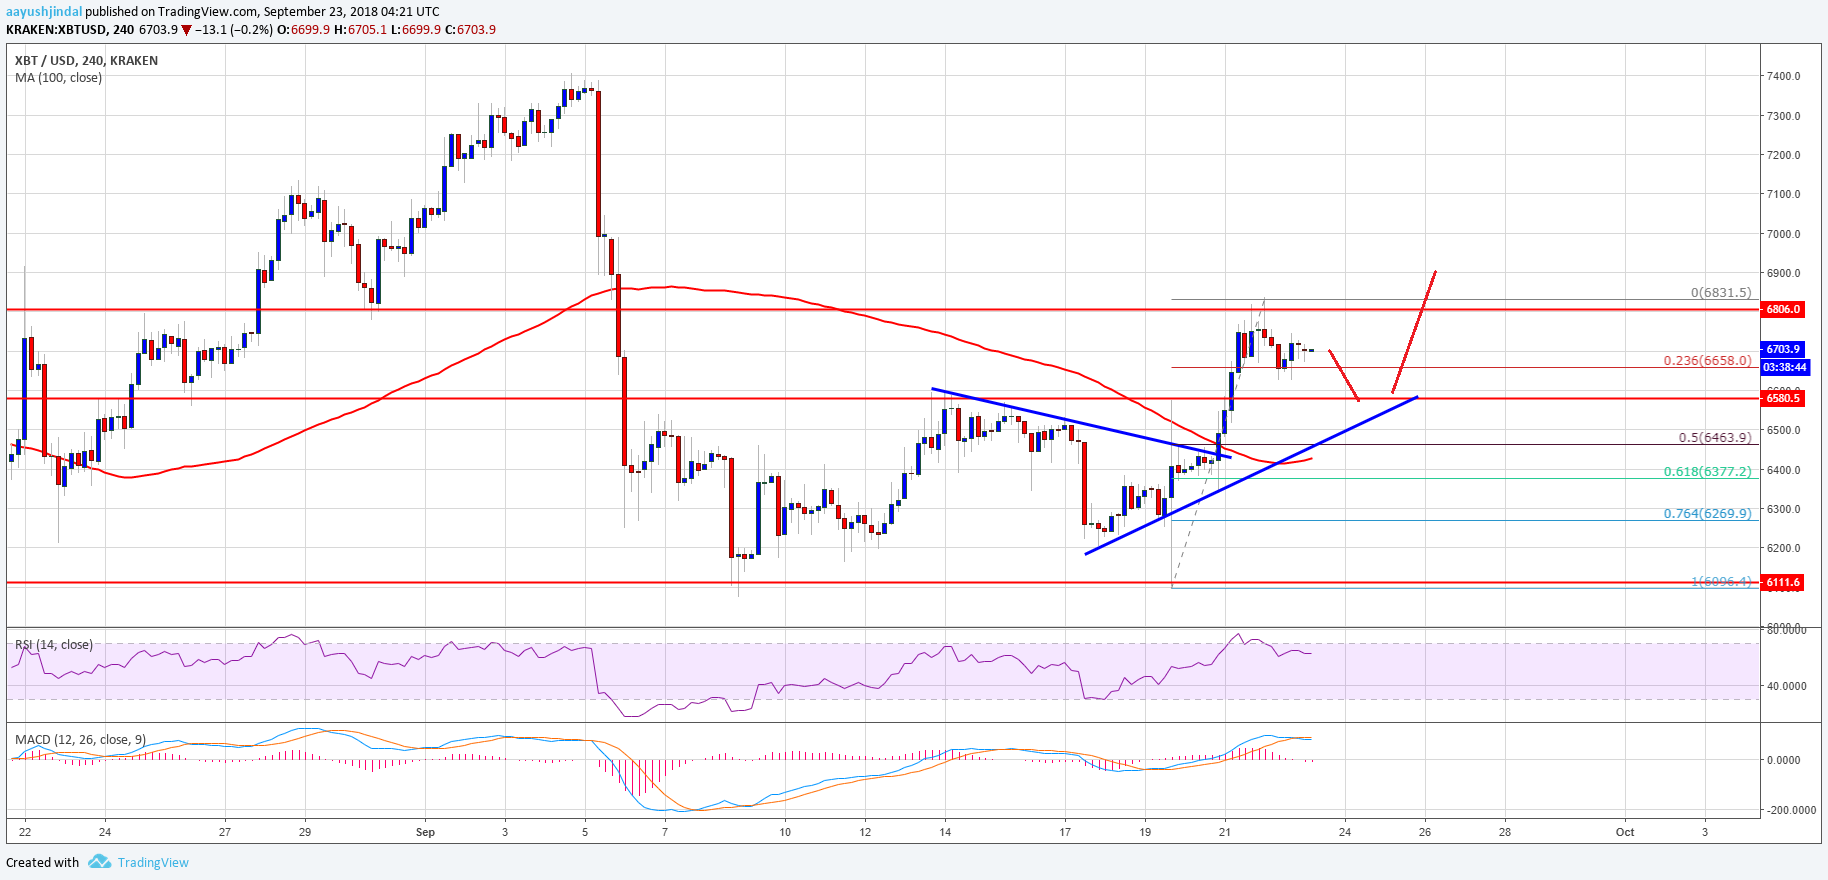
Looking at the chart, BTC price is facing a lot of hurdles near the $6,850 level. Above this, buyers need to surpass the $7,000 level to move into a medium term bullish zone. The final target could be $7,350 if buyers overcome $7,000.
Looking at the technical indicators:
4-hours MACD – The MACD for BTC/USD is slightly placed in the bearish zone.
4-hours RSI (Relative Strength Index) – The RSI is well above the 50 level.
Major Support Level – $6,550
Major Resistance Level – $6,850


