
Reason to trust
How Our News is Made
Strict editorial policy that focuses on accuracy, relevance, and impartiality
Ad discliamer
Morbi pretium leo et nisl aliquam mollis. Quisque arcu lorem, ultricies quis pellentesque nec, ullamcorper eu odio.
Bitcoin price started a downside correction from the $28,360 high against the US Dollar. BTC remained well bid above $26K, and it is likely to resume higher towards $28K.
- Bitcoin is showing a lot of positive signs above the $26,000 support zone.
- The price is currently trading above the $26,500 support and the 100 hourly simple moving average.
- There was a break above a major contracting triangle with resistance near $26,800 on the hourly chart of the BTC/USD pair (data feed from Kraken).
- The pair is likely to continue higher towards the $28,000 and $28,400 resistance levels.
Bitcoin Price is Showing Bullish Signs
In the past few days, there was a strong increase in bitcoin price above the $25,000 resistance. BTC even surged above the $26,500 and $27,000 resistance levels. Finally, the price surged above the $28,000 level and settled well above the 100 hourly simple moving average.
A new all-time high was formed near $28,360 before the price started a downside correction. It traded sharply below the $27,000 level. There was also a break below the 50% Fib retracement level of the upward move from the $24,532 swing low to $28,361 high.
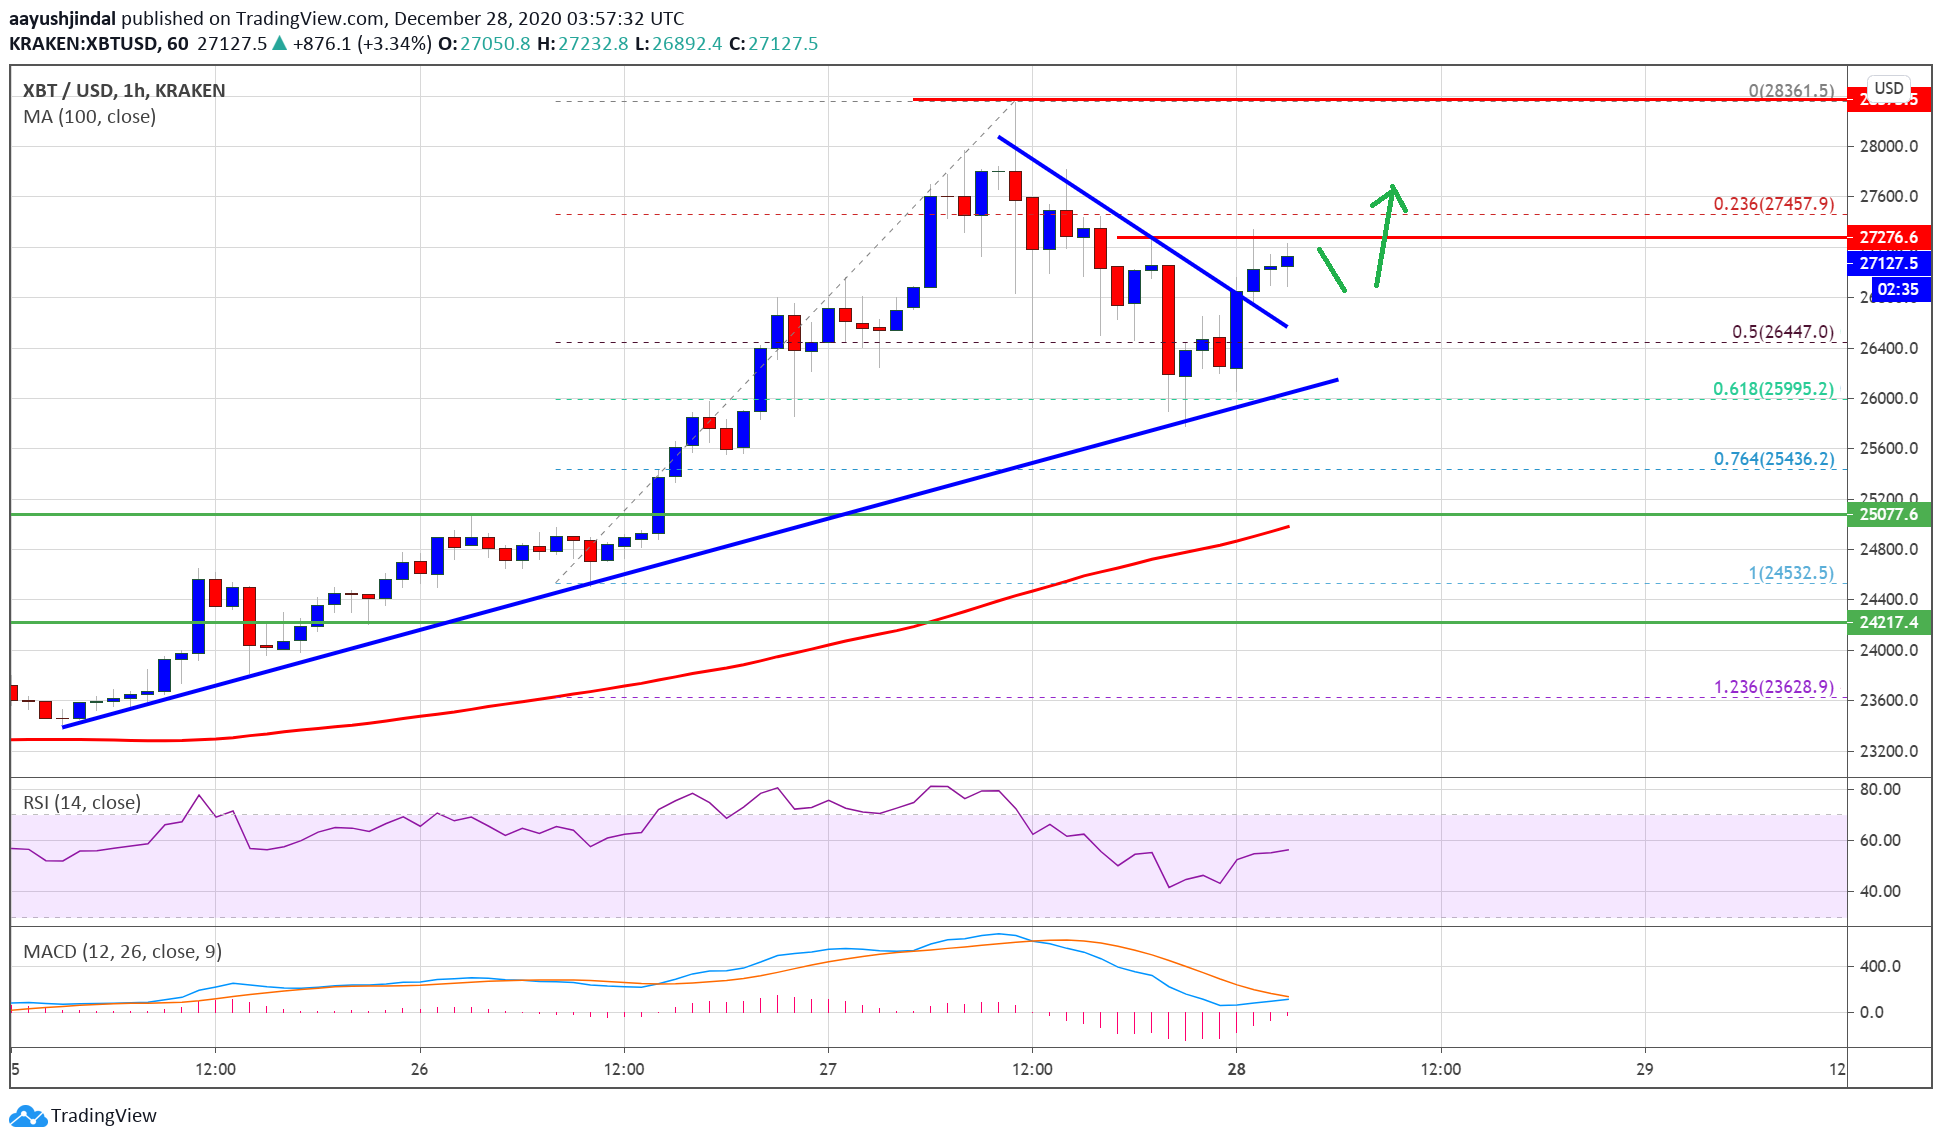
Source: BTCUSD on TradingView.com
However, the bulls were active around the $26,000 support level. The 61.8% Fib retracement level of the upward move from the $24,532 swing low to $28,361 high also acted as a strong support.
Bitcoin price started a fresh increase above the $26,500 resistance. There was also a break above a major contracting triangle with resistance near $26,800 on the hourly chart of the BTC/USD pair. The pair is now trading above the $27,000 level.
An initial resistance on the upside is near the $27,275 level. A clear break above the $27,275 resistance could open the doors for a fresh run towards the $28,000 and $28,400 levels in the near term.
Fresh Drip in BTC?
If bitcoin fails to clear the $27,275 resistance level, it could correct lower. An initial support on the downside is near the $26,800 zone and the broken triangle trend line.
The first major support is near the $26,500 level. The main support is still near the $26,000 level, below which there is a risk of a sustained downward move in the coming sessions.
Technical indicators:
Hourly MACD – The MACD is gaining momentum in the bullish zone.
Hourly RSI (Relative Strength Index) – The RSI for BTC/USD is currently well above the 50 level.
Major Support Levels – $26,500, followed by $26,000.
Major Resistance Levels – $27,275, $28,000 and $28,400.


