Highlights:
- Booming global panic could prompt Bitcoin traders to break long-term support trendline.
- A key technical indicator is confirming a breakdown towards $6,500, bitcoin’s reliable price floor during the 2018 crash and also the 2019’s bottom.
Bitcoin is risking declines to as low as $6,500 as panicked sellers threaten to break a long-term support area.
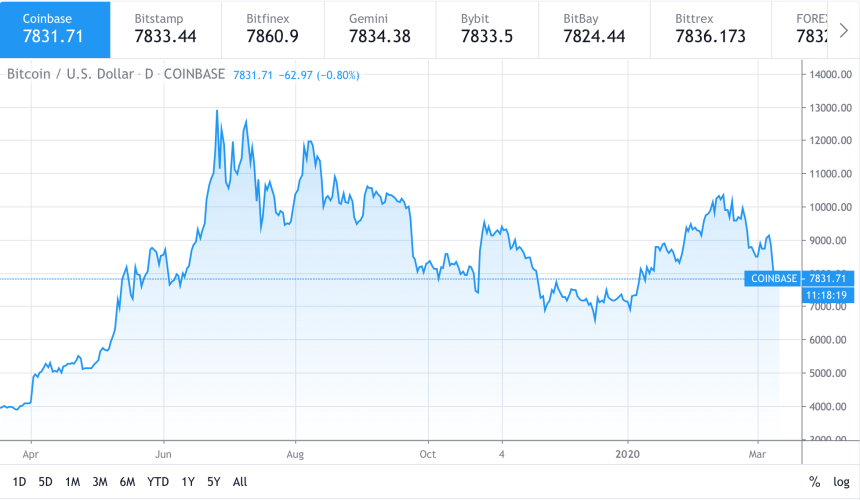
The benchmark cryptocurrency plunged 0.62 percent on Wednesday, suggesting that its downside momentum is likely to extend further. The bearish sentiment followed a frantic week that saw bitcoin tanking from $9,214 to as low as $7,630. It attempted a shy rebound on Tuesday but failed to transform the move into an actual recovery.

Fundamentals before Technicals
Experts gave plenty of reasons to justify the bitcoin’s $2,000-plunge: all from whale manipulation to PlusToken scammers selling their steal. But the most-discussed among them was Coronavirus. The fast-spreading virus hammered down the global stock market. Bitcoin fell in tandem, leading analysts to see a convincing correlation between the cryptocurrency and equities.
“It is very common in times of turmoil that investors sell their best performing investments rather than their worst,” said Alistair Milne, CIO of Altana Digital Currency Fund. “Many can’t stomach selling at a loss. IMO this is why Bitcoin is currently ‘correlating’ (clearing out the weak hands) with stocks.”
It is very common in times of turmoil that investors sell their best performing investments rather than their worst. Many can't stomach selling at a loss.
IMO this is why Bitcoin is currently 'correlating' (clearing out the weak hands) with stocks.
No. Free. Rides.
— Alistair Milne (@alistairmilne) March 10, 2020
With no vaccine in sight for another 12-18 months and the number of infected and dead people rising, Coronavirus may end up affecting the global financial market for a longer timeframe. Bitcoin’s reaction to the epidemic so far has been disappointing, which could be one of the reasons why the cryptocurrency is risking a fall towards its 2018 support of $6,500.
And technicals say the same.
Bitcoin’s Long-term Supports Meet
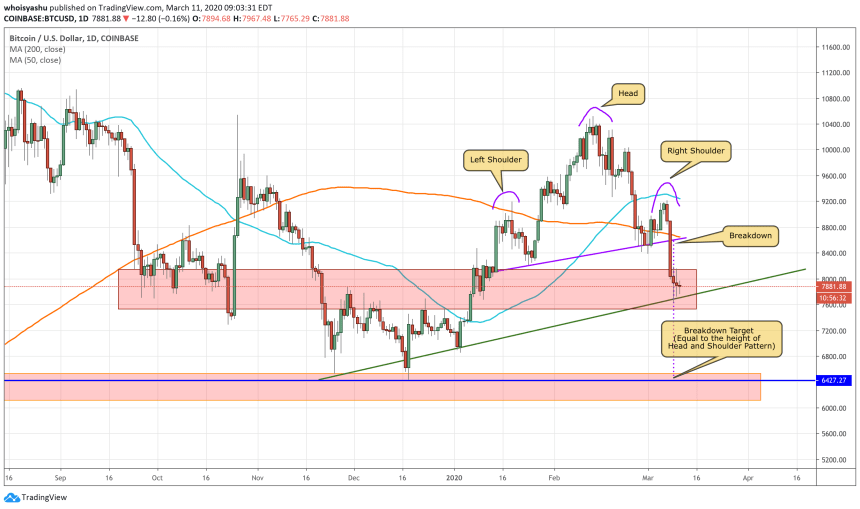
Bitcoin this week confirmed the existence of a textbook technical indicator, commonly known as Head and Shoulders. The cryptocurrency made three peaks (purpled), with the middle one inching higher than the other two, all supported by a baseline (purpled). On Sunday, the price fell below the baseline, confirming that a breakdown scenario is LIVE.

Bitcoin is now testing a long-term support (greened ascending trendline), albeit shyly. Interestingly, the current floor is at a confluence with another support range represented using a red rectangular bar. Bitcoin has a history of rebounding from the said zone. At the same time, failing to bounce-back has crashed the price to below $6,500.
Fun fact: The downside target of the Head and Shoulder pattern, which technically equals the length between baseline and head, is also $6,500. Traders relying on technical indicators could, therefore, test the said level should bitcoin plunged anymore below the red area and the greened trendline support.
If only investors magically start seeing safety in bitcoin, which is unlikely due to its underlying price volatility, the cryptocurrency could manage to hold above the long-time support.


