Bitcoin Price Key Highlights
- Bitcoin price staged a massive selloff after breaking below the descending triangle bottom previously highlighted.
- Price has dropped by around $3,000 and could have a few more losses to go before bottoming out.
- Bitcoin is currently finding support at a Fib retracement level but might be due for a larger pullback.
Bitcoin price sold off sharply earlier this week and may have a few more losses lined up before bulls return.
Technical Indicators Signals
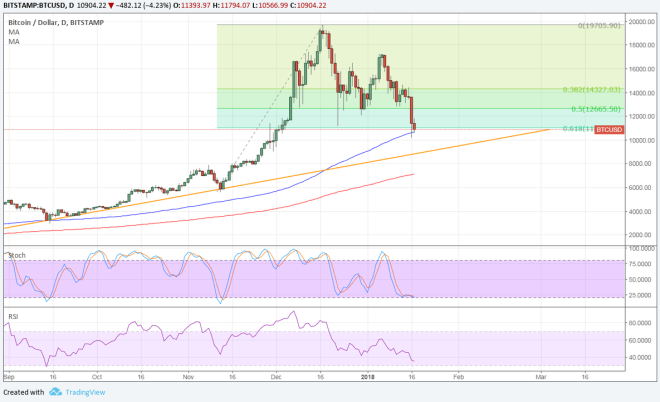
The 100 SMA is above the longer-term 200 SMA on the daily time frame to show that the path of least resistance is to the upside. The gap between the moving averages is widening to reflect stronger bullish momentum and the 100 SMA is currently holding as dynamic support.
Stochastic also looks ready to turn higher but has a bit of room to go before hitting oversold levels. This suggests that bitcoin price could still dip to the ascending trend line support on the daily chart. This is located closer to the $9,000 level.
RSI also has some room to drop so bitcoin price could follow suit. A return in bullish momentum could lead to a move up to the nearby area of interest at $12,000-13,000 while a break below the trend line could still find support at the 200 SMA.

Market Factors
Persistent concerns on the ongoing crackdown in bitcoin trading and mining in South Korea and China are weighing heavily on bitcoin price and other cryptocurrencies. When the tech level broke, more sellers joined in and exacerbated the drop.
Meanwhile, the dollar is also on weak footing as the euphoria over the tax plan has faded and the attention is turning to a possible government shutdown. Equities also closed in the red as the oil price decline weighed heavily on the energy sector.
More updates on the bitcoin crackdown in South Korea could influence price from here, although another dip could encourage bulls to buy at cheaper levels.