Bitcoin Price Key Highlights
- Bitcoin price appears ready to resume its climb as it found support on long-term inflection points.
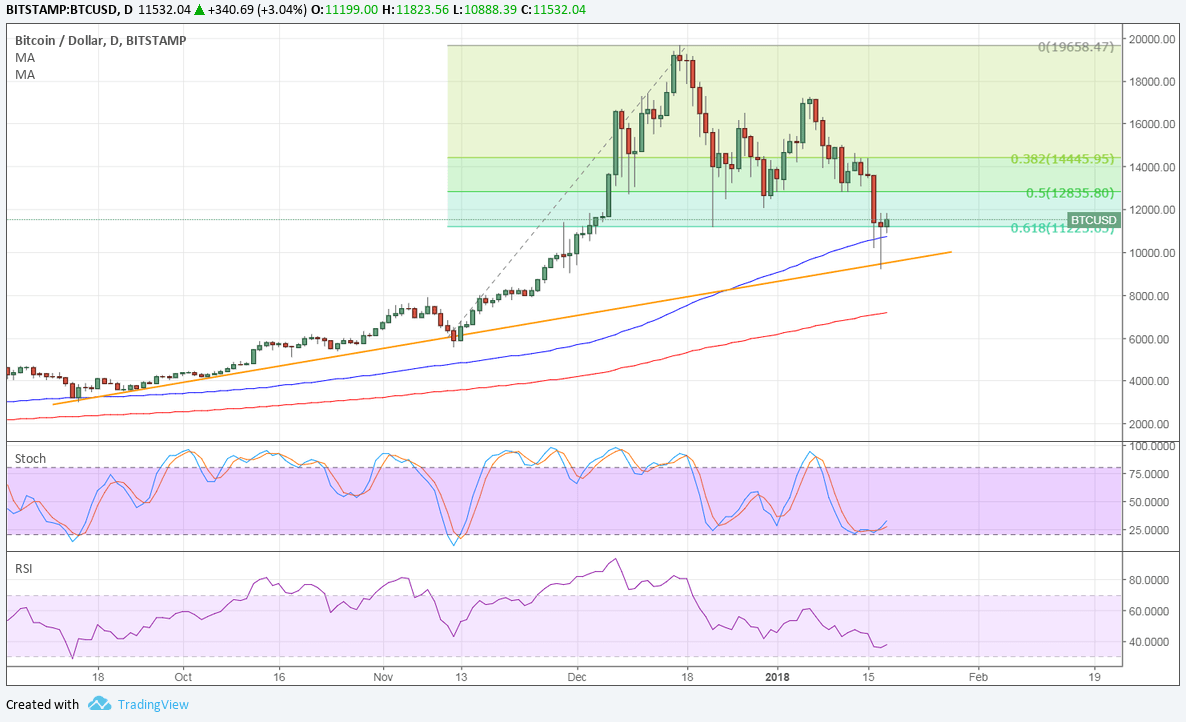
- Bitcoin price also formed a spinning top at the test of the ascending trend line on the daily time frame.
- A move above the 61.8% Fibonacci retracement level could draw more buyers to the mix.
Bitcoin price found support and formed a reversal candlestick pattern on a major inflection point, so the next daily candle close might be crucial.
Technical Indicators Signals
Despite the recent sharp selloff, the 100 SMA is safely above the longer-term 200 SMA on the daily time frame. This confirms that the path of least resistance is to the upside and that the climb could be ready to resume.
In addition, the gap between the moving averages is still widening to reflect strengthening bullish momentum. The 100 SMA has held as dynamic support as well.
The next daily candle could close above the previous spinning top’s high and possibly confirm that the correction is over. From there, bitcoin price could proceed to the area of interest around $13,000 and a move higher could lead to a test of the highs closer to $16,000.
Stochastic appears to be bottoming out and ready to turn back up without even hitting oversold levels, which suggests that bulls are eager to take advantage of these lower prices. RSI seems to have some room to drop, though, so another dip may be in order.

Market Factors
Reports that Bitconnect is closing reminded traders of the stability of bitcoin compared to rival altcoins, which could actually turn out to be scams. So far, it looks like the test of the $10,000 major psychological level has drawn more buyers looking to get in at cheaper prices.
However, some analysts remarked that bitcoin price hasn’t bottomed out yet and could test further lows closer to $5,000. Fears of cryptocurrency bans in China and South Korea are being blamed for the recent slide but many believe that the overbought market is a factor as well.
With that, it’s no surprise that bitcoin has reverted to the mean and may only be seeing increased buying pressure at lower levels.