Bitcoin Price Key Highlights
- Bitcoin price resumed its selloff after completing a quick pullback off its recent slide.
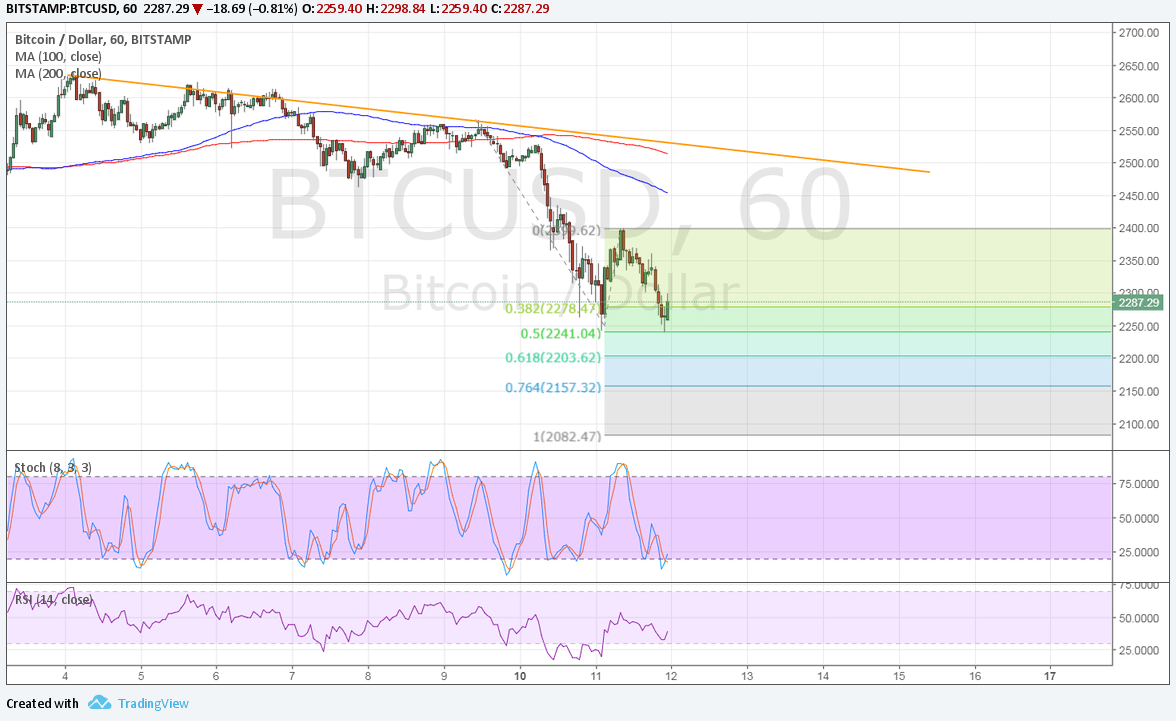
- Applying the Fibonacci extension tool on the correction move shows the next downside targets.
- Price is currently bouncing off the 50% extension and might be due for another pullback.
Bitcoin price is testing recent lows after its brief correction, signaling that bearish momentum is still in play.
Technical Indicators Signals
The 100 SMA is below the longer-term 200 SMA so the path of least resistance is to the downside. The gap between the two is widening to reflect stronger selling pressure. In addition, the 200 SMA lines up with a descending trend line connecting the highs since the start of the month, and this could act as the last line of defense in this selloff.
If bears stay in control, bitcoin price could dip to the 61.8% extension at $2200 next or onto the 76.4% level at $2150 then onto the full extension just below $2100. However, Stochastic is already indicating oversold conditions and looks ready to turn higher so buyers might get back on their feet.
RSI is already moving up so bitcoin price might follow suit. A break past the pullback to $2400 could complete the formation of a small double bottom and signal a short-term reversal from the dive.

Market Factors
Resurfacing concerns on the bitcoin hard fork have dampened demand for the cryptocurrency these days, along with the pickup in global risk appetite. Traders typically buy up bitcoin during times of uncertainty but the optimism among central bankers recently has allowed stocks and commodities to recover.
In addition, bearish forecasts from several analysts like those from BlackRock have weighed on bitcoin price as holders were convinced to liquidate positions. “I look at the charts, and to me, that looks pretty scary,” said analyst Richard Turnill.
Turnill also mentioned that the rise in bitcoin price has mostly been fueled by easy monetary policy in the past decade and removal of this stimulus could lead to the unwinding of gains. This reminded market participants of speculations that bitcoin is in a bubble and that it is already starting to burst.