Bitcoin Price Key Highlights
- Bitcoin price continues to trade close to its record highs, still waiting for a big market catalyst to lead to another leg higher.
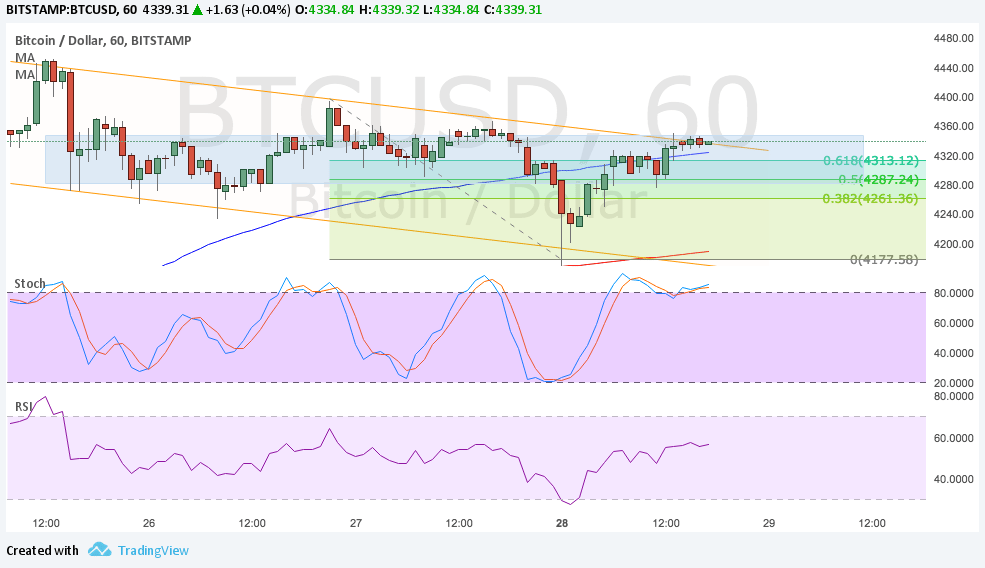
- In the meantime, profit-taking seems to be weighing on gains as the price is moving inside a descending channel visible on the 1-hour time frame.
- If the area of interest holds as a ceiling, bitcoin price could resume its drop to the swing low at $4200.
Bitcoin price is starting a short-term downtrend while traders wait for the next catalyst to sustain the rally.
Technical Indicators Signals
The 100 SMA is above the longer-term 200 SMA on the 1-hour chart so the path of least resistance is to the upside. In that case, an upside break past the channel resistance at $4350 remains a possibility.
However, it’s also worth noting that the 100 SMA is holding as a dynamic inflection point at the moment. A dip to the channel support could test the dynamic inflection point at the 200 SMA.
Stochastic is already indicating overbought conditions, which means that buyers need to take a break and let sellers take over. RSI has room to climb so there may be some bullish momentum left in play for an upside break. Once both oscillators start turning lower, sellers could regain the upper hand and lead to a continuation of the sell-off. On the other hand, an upside break past the resistance could lead to a test of the all-time highs or the creation of new ones.

Market Factors
Dollar weakness and risk-off moves appear to be keeping Bitcoin price afloat in the meantime as investors are on the hunt for higher returns in alternative markets.
Medium-tier data from the US economy has been mostly disappointing and the impact of Hurricane Harvey on the US Gulf Coast could likely put a dent in Q3 economic growth. A lot hinges on the upcoming August NFP release since this could shape expectations for the September FOMC meeting.
Downbeat data could delay the next Fed rate hike to December or even early next year, also likely be weighing on balance sheet runoff estimates, leading Bitcoin price to take advantage.