Bitcoin Price Key Highlights
- Bitcoin price has been unable to establish a clear direction in the past few days as traders seem to be waiting for the top-tier catalysts.
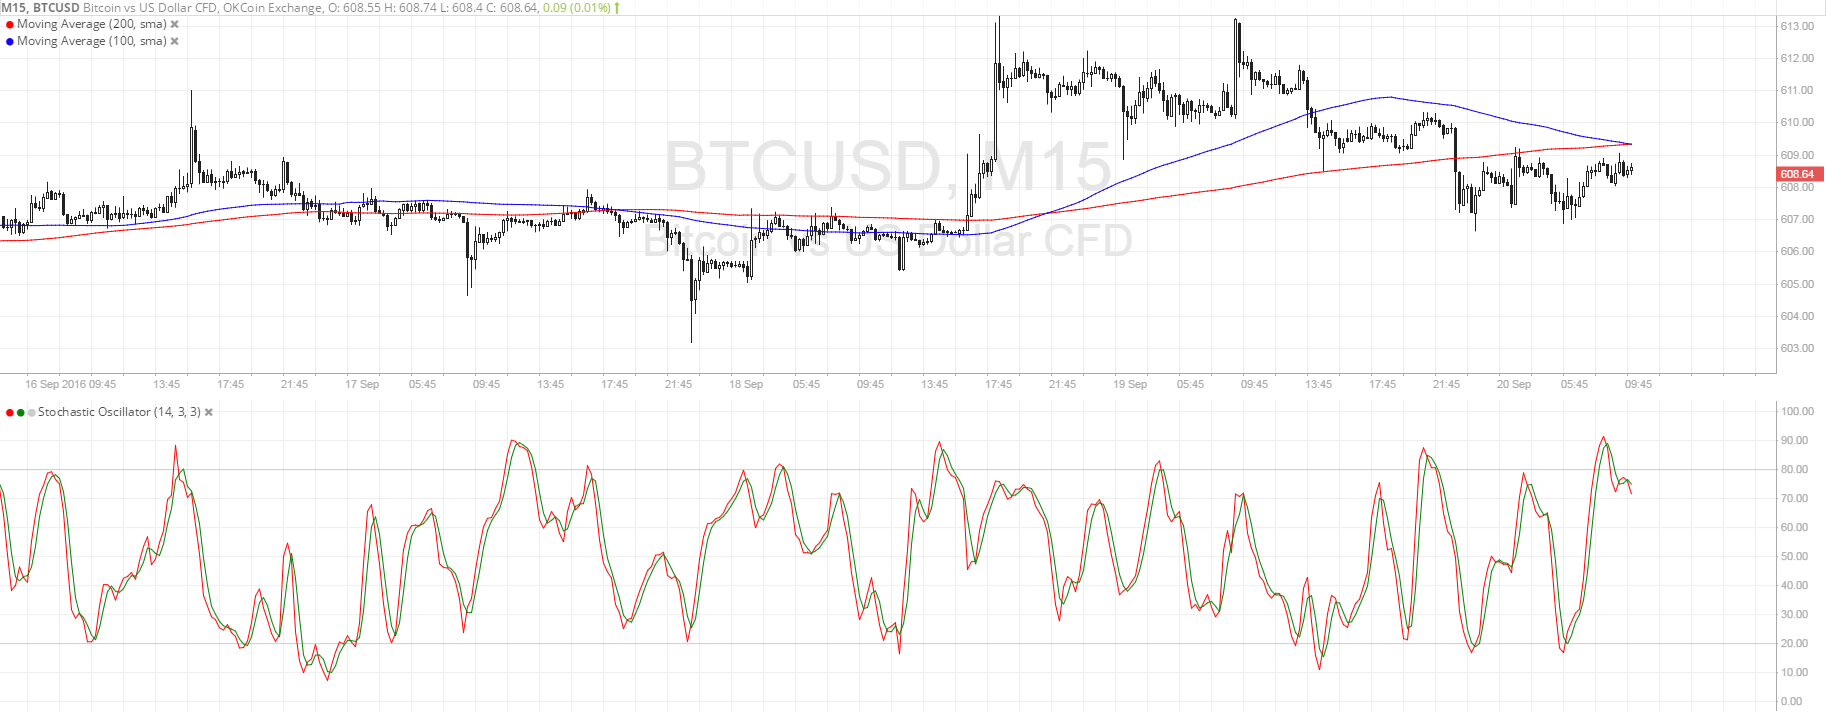
- On the shorter-term time frames, it can be seen that bitcoin price seems to be heading close to the support at $605.
- A small reversal pattern can be seen so a bounce might be due but technical indicators are hinting otherwise.
Bitcoin price might be aiming for a bounce off the nearby support zone, although a downside break is also possible.
Technical Indicators Signals
The 100 SMA is crossing below the longer-term 200 SMA on its 15-minute time frame, suggesting that the path of least resistance is to the downside. If so, BTCUSD could attempt to break below the nearby floor at $605 for a test of the next support around $580.
Stochastic is turning down from the overbought zone to show that bearish momentum is building up. A candle closing below the recent lows at $607 could be enough to confirm this return in selling pressure.
On the other hand, a move past the dynamic resistance around the moving averages could lead to a climb up to the highs at $613. Further gains past that point could push bitcoin price up to the longer-term resistance at $640.

Market Events
The highly-anticipated FOMC decision is coming up on Wednesday’s New York trading session, likely resulting to a breakout for bitcoin price. Until then, this consolidation is expected to carry on since market participants seem hesitant to take on large positions ahead of the top-tier event.
Traders still seem to be divided on their expectations for the outcome since there’s a strong chance of a hawkish move. Economic data from the U.S. has shown consistent improvements but prudent members might argue to stay on hold until external risks abate.
If so, traders could put their focus on the revised economic projections since this would clue the markets in for what the Fed has up its sleeve for the rest of the year. Upgrades could keep expectations for a December hike in play, likely keeping the dollar supported against bitcoin price still.
Charts from SimpleFX