Bitcoin Price Key Highlights
- Bitcoin price seems to be running out of steam for its climb, so a major pullback might be due.
- Price is still stuck in consolidation as seen on short-term time frames as traders are waiting for the next big catalyst.
- Applying the Fib tool on the rally since April shows potential correction levels on the daily chart.
Bitcoin price looks prime for a large correction as it is stalling on its recent rally before more buyers join in at retracement areas.
Technical Indicators Signals
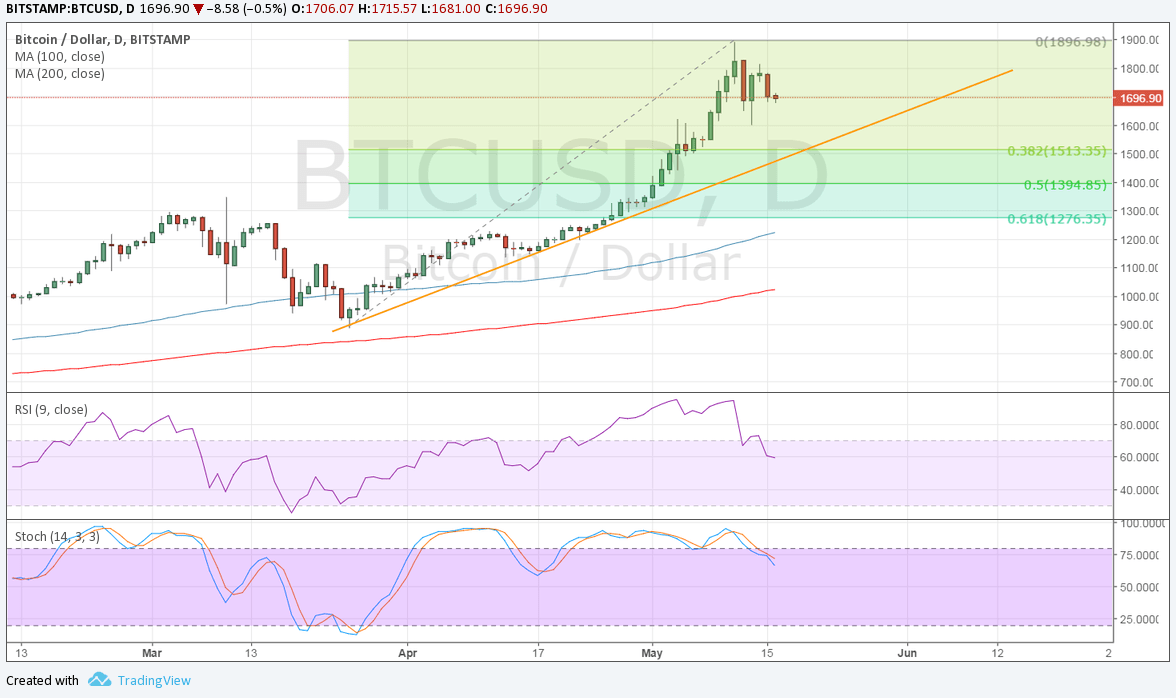
The 100 SMA is still above the longer-term 200 SMA on the daily chart so the path of least resistance is to the upside. Also, the gap between the moving averages is sufficiently wide so the uptrend could carry on rather than reverse.
RSI is on its way down so bitcoin price might follow suit. Similarly stochastic is on its way down to suggest that a pickup in selling pressure is in order. This could lead to a pullback to the rising trend line support connecting the lows so far this quarter.
Applying the Fib tool on the swing low and high shows that the 38.2% retracement level lines up with the rising trend line, acting to its strength as a potential floor. A larger correction could last until the 61.8% Fib around $1200-1300, which might be the line in the sand for the uptrend. A break below this could mark the start of a longer-term selloff.

Market Events
Traders are waiting with bated breath on the SEC decision regarding the COIN bitcoin ETF. Approval would mean better market access and liquidity, as well as stronger legitimacy as the cryptocurrency would be subject to regulation. However, the odds of approval have been tainted by the recent global cyberattack since perpetrators have demanded bitcoin as payment for ransom.
This reminded market participants and regulators of the prevalent use of bitcoin in criminal activity in the past, signaling that a lot of work has to be done before the cryptocurrency is deemed safe for investors. Either way, watch out for potential breakouts on the short-term charts after the SEC announcement since this might determine whether a large correction or a continuation of the rally is due.