Things are really starting to pick up now in the bitcoin price space. Action during the European session today has brought the bitcoin price to trade in excess of $4700 and the $5000 mark is looking like a near term reality. We have to keep in mind that we have seen some pretty serious corrections in this market over the last few years and that if anything injects a degree of risk off attitude into the markets near term, we may see one such correction from current levels. Don’t worry though. Even if we do see a correction like this, it merely represents a nice opportunity to pick up an exposure to bitcoin at a discount to current market rates. Price will turn around and continue to rise.
We are all about intraday trading here, of course, so let’s not get caught up in the macro side of things. Instead, let’s get some levels in place with which we can push forward into the markets and see if we can pick up some short-term profits. As ever, take a quick look at the chart below before we get started so as to get an idea where things stand. It is a one-minute candlestick chart and it has our key levels overlaid in red.
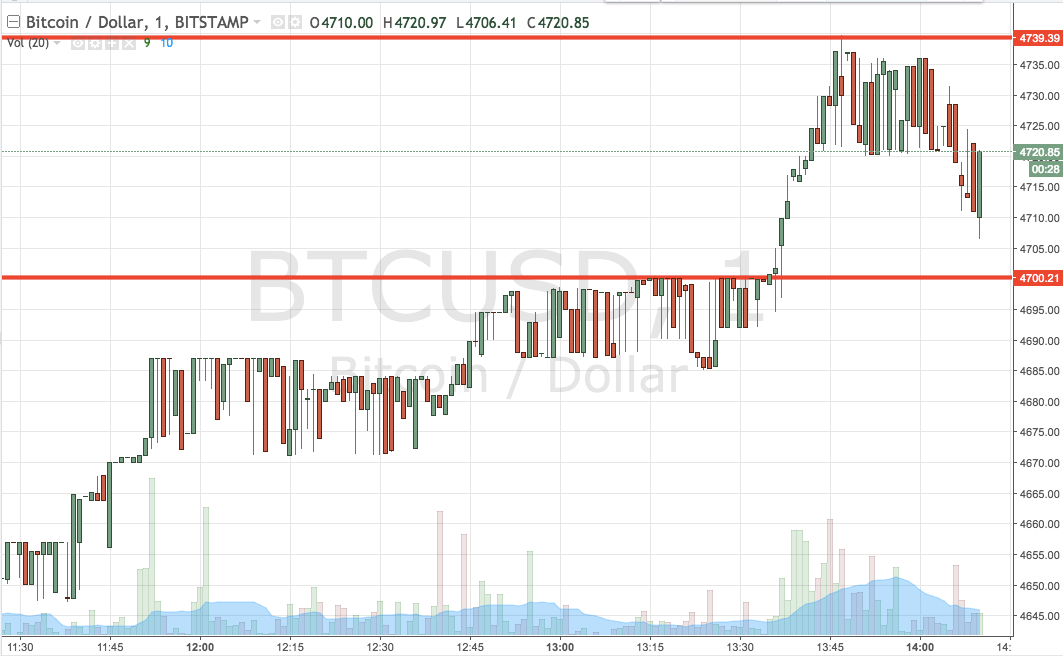

As the chart shows, the range we are using for the session today comes in as defined by support to the downside at 4700 and resistance to the upside at 4739. We are just going to use our breakout strategy for the time being.
Specifically, if we see price break above resistance, we will enter long towards a target of 4790. A stop loss on the trade at 4725 looks good. Looking the other way, a close below support will have us in towards 4640. A stop loss on this one at 4715 works well.
Charts courtesy of Trading View