In yesterday evening’s bitcoin price analysis, we highlighted the fact that bitcoin was closing in on $10,000 and that, if we saw a break of that level, there was a good chance we would see a considerable degree of follow-through on the back of the break. Why? Because this sort of action nearly always translates to some psychologically driven loading and the fear of missing out causes fringe participants to pick up positions.
What we didn’t predict was just how far this follow-through would go.
The bitcoin price is currently trading around $10,700 apiece – up close to $1,000 on yesterday’s action alone.
We have said it on a couple of occasions over the last few days and we will say it again – we are almost certain to see some degree of correction near term. How steep this correction will be remains to be seen but, that it is coming, is a certainty.
All we can do is set up against the intraday charts as we see them and try to be ready for any correction as and when it does hit.
So, with this in mind, let’s get some levels in place that we can use to try and do just that. As ever, take a quick look at the chart below before we get started so as to get an idea where things stand and where we are looking to jump in and out of the markets according to the rules of our intraday strategy.
The chart is a five-minute candlestick chart and it has our range overlaid in green.
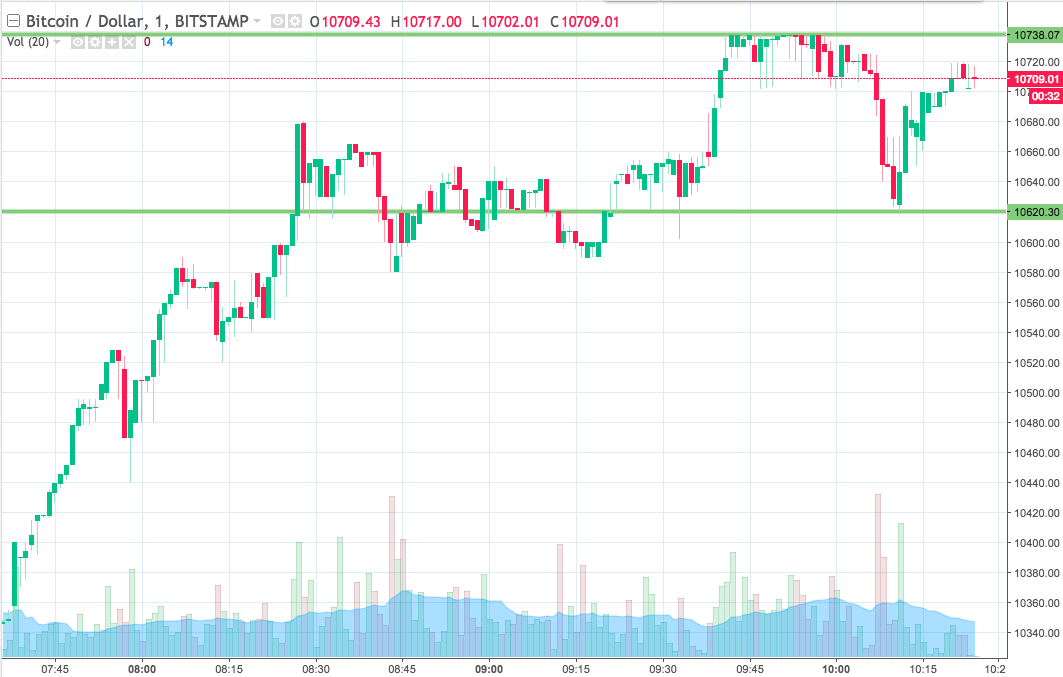

As the chart shows, the range we are looking at for the session today comes in as defined by support to the downside at 10,620 and resistance to the upside out 10,738.
If we see a close above resistance, we will jump into a longer trade towards an immediate upside target of 10,770. Conversely, a close below support will have us in short towards 10,580.
Let’s see what happens.
Charts courtesy of Trading View