So here we go, off for a fresh week’s worth of trading in the bitcoin price. Last week we managed to get some pretty decent action, and this allowed us to pull out a couple of market profits. This week, we’re hoping for much of the same. Things have been relatively volatile over the weekend, and this bodes well going forward for today’s session. Even if it doesn’t suggest volume, it gives us some nice well defined levels to go at, and these levels can be easily incorporated in to today’s strategy.
So, with this in mind, and as we head into today’s session, let’s take a look at what’s going on in the bitcoin price, and where we can look to get in and out of the markets according to our intraday strategy this morning.
As ever, take a quick look at the chart below to get an idea of our focus areas. It’s a five minute candlestick chart and it has the last twelve hours or so worth of action displayed, with our key levels outlined in green.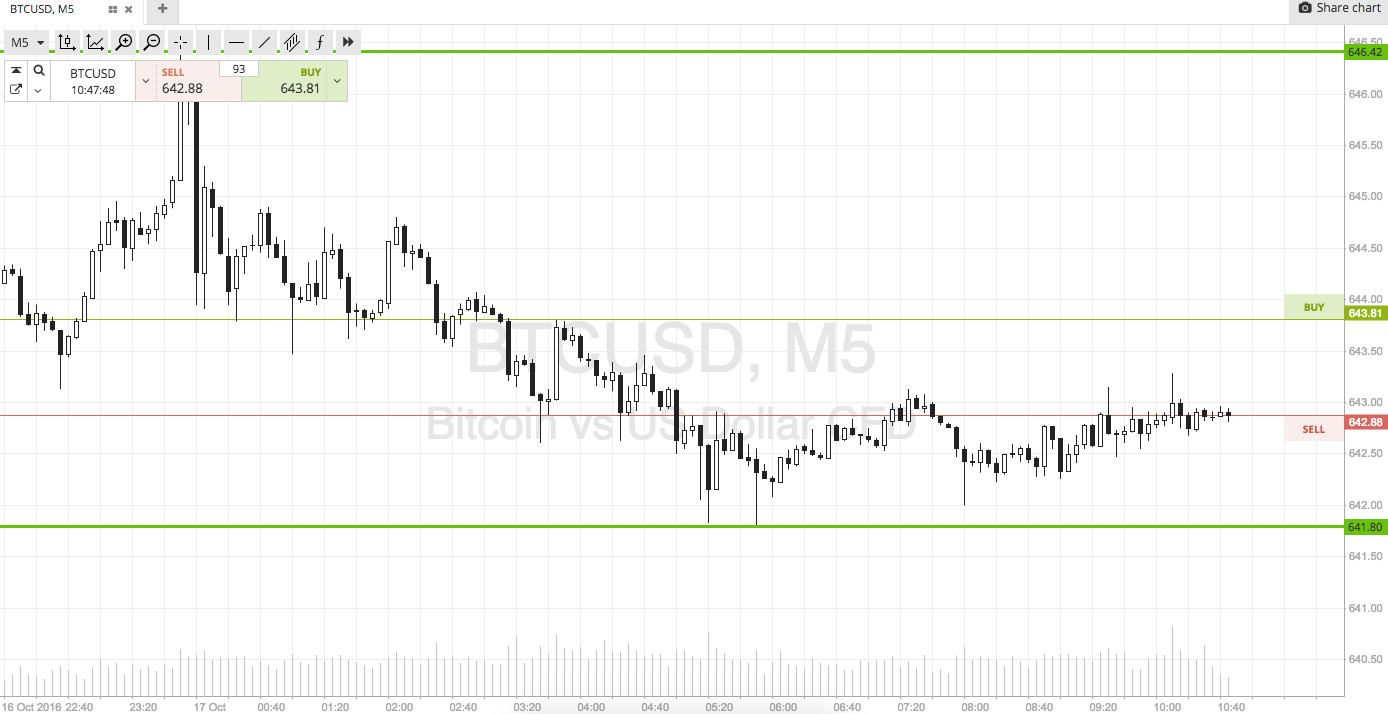

Asthe chart shows, the range in focus for today’s session is defined by in term support to the downside at 641 and in term resistance to the upside at 646. We are going to focus purely on a breakout strategy this morning, so intrarange (at least for now) is not on the table.
If we see price run to the upside and get a break through resistance, we will get in long towards an immediate upside target of 652. This isn’t overly aggressive, but it gives us enough reward to go at price with a reasonably wide stop, and somewhere in the region of 643 flat looks good on the trade.
Looking south, a close below support will put us in a short trade towards 635. A stop on this one at 643 once again keeps a handle on our upside risk.
Happy trading!
Charts courtesy of SimpleFX