It’s Monday morning, and we have got a fresh week of trading ahead of us in the bitcoin price. Last week gave us plenty to discuss, with volatility carrying price through to fresh highs on a number of occasions, but action over the weekend has settled down a little bit. From reaching highs of nearly 780 on Saturday night, price corrected to an intraday close at around 730, and has since traded sideways to current levels. So, with this said, and as we head into today’s European session, where are we looking to get in and out of the markets according to our intraday strategy, and how can we use the action seen over the weekend to give us something to go at today? As ever, take a quick look at the chart below to get an idea of what’s on. It is a 15 minute candlestick chart that shows the last 24 to 48 hours worth of action, and has today’s range overlaid for clarity.
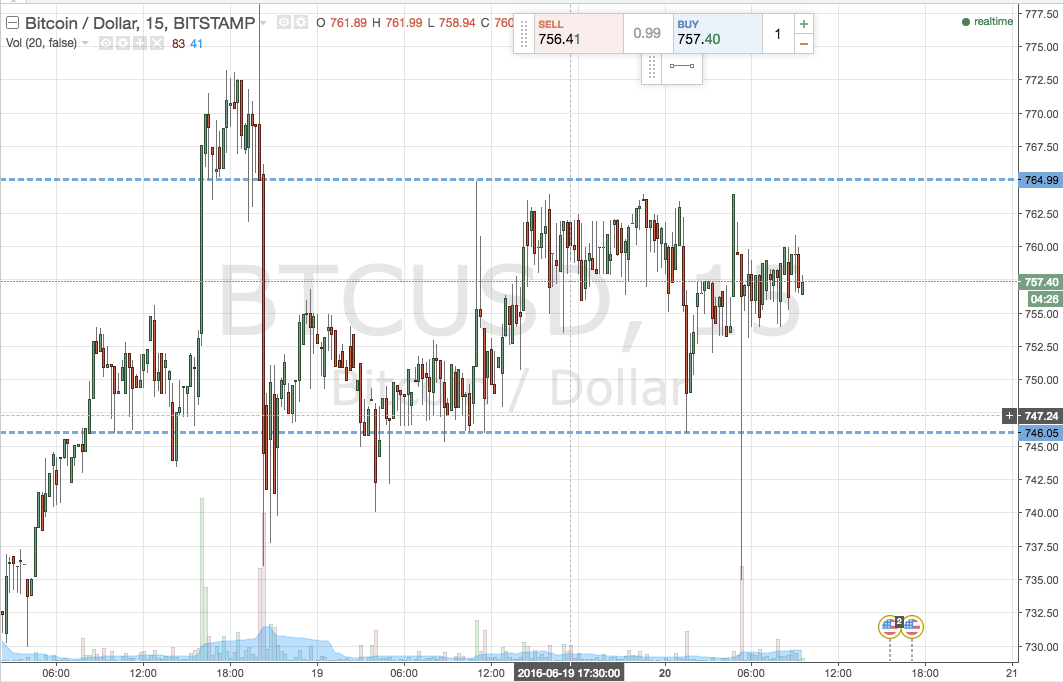

As the chart shows, the range we are looking at for today’s session is defined by support to the downside at 746, and resistance to the upside at 765. Both levels represent the most recent swing low and swing high respectively, and serve as pretty solid parameters moving forward.
We will be focusing on a breakout strategy and an intrarange strategy today. So, with this said, we will look to enter long on a close above resistance at 765, with a stop loss around 761 flat and an upside target of 772. Looking away, if price breaks and closes below support, we will enter short towards 736. Again we need a stop loss, and somewhere in the region of 750 looks good from a risk management perspective.
Looking at intrarange, if price bounces from support it will signal a long entry towards resistance, and the reverse entry on a correction from resistance.
Charts courtesy of Trading View