So here we go. We are in the home straight now, and closing in on what has been one of our best weeks in a while in the bitcoin price. Action has been incredibly volatile, and we have seen a number of key support and resistance levels broken on pretty high-volume trading. High volume generally means sustained momentum, and sustained momentum translates to effective breakout trades. We have a couple of sessions left, and we are hoping to finish out the week as strongly as we started it. So, with this in mind, and as we move into this final leg, let’s see if we can’t continue our record. As ever, take a look at the chart below to get an idea of what we’re focusing on. It is a five-minute candlestick chart, and as some will notice immediately, we are widening out our range from our standard width, in an attempt to capture some slightly larger moves.
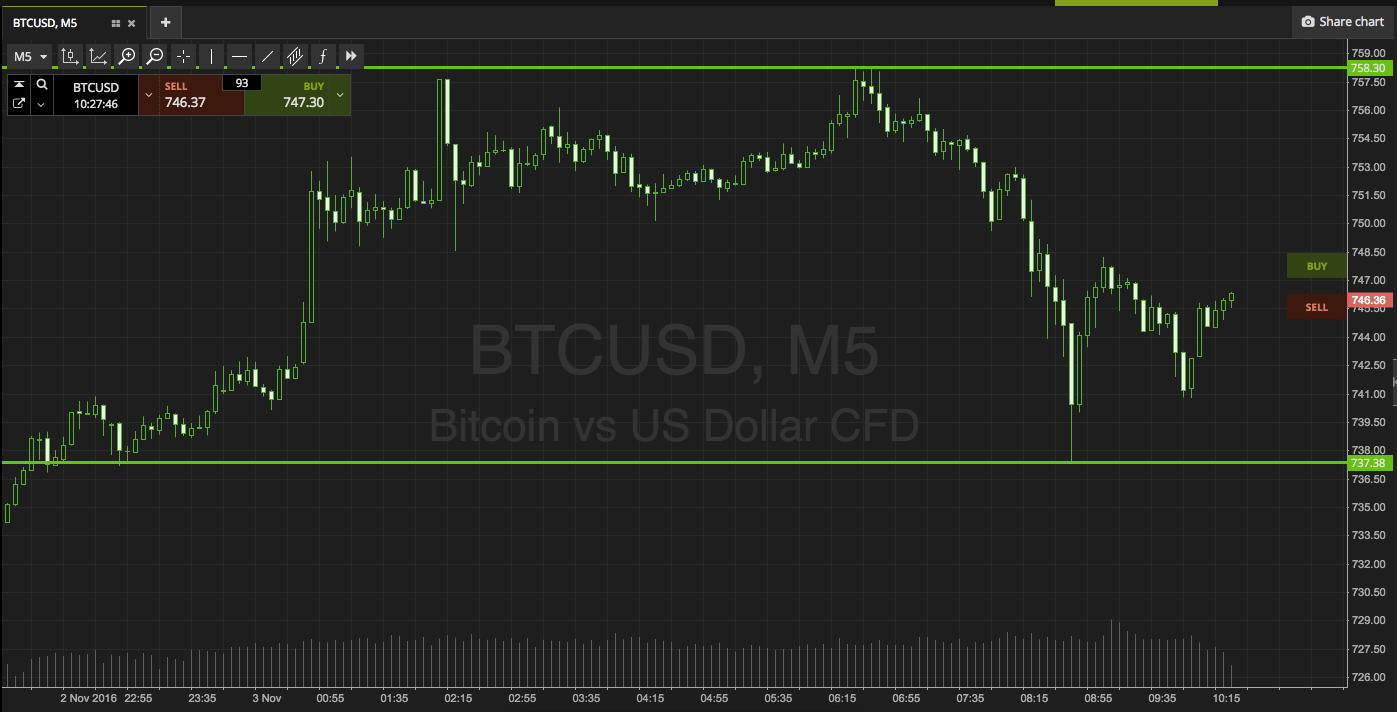

As the chart shows, the range we are focusing on this morning is defined by support to the downside 737 and resistance to the upside at 758. With around $20 worth of range to go at here, there is more than enough space to have a go at intrarange entry if price dictates that it is valid. Specifically, we are going to go long on a bounce from support with a target of resistance, and a stoploss just below support to ensure we are taken out the trade incase price breaks to the downside. Conversely, a correction from resistance will signal short towards support, with a stoploss in a similar position reflective of the trade direction.
If we get a breakout, we will enter in the direction of the break towards a target of somewhere in the region of $10 above or below, depending on the entry. Again, a stop loss is necessary to make sure we limit our downside risk, and two or three dollars inside the range against the direction of the trade works well.
Charts courtesy of SimpleFX