So that is another day complete from a European perspective in our bitcoin price trading efforts and, just as we suggested might be the case this morning, it’s been a pretty strange one. Action is all over the place at the moment and this is making difficult to establish any sort of consistent strategy. It’s not impossible, of course, and our intraday strategies were designed to make it as simple as possible, but it does mean that we have had to be extra careful with our target placement and our risk management parameters so as to avoid being chopped out on the back of any erratic movement.
So, with this noted, let’s try and move forward and continue to draw profit from the market as and when things move. As ever, take a quick look at the chart below before we get started so as to get an idea where things stand and where we are looking to jump in and out the markets according to the rules of our albeit revised intraday strategy near-term. The chart is, as usual, a one-minute candlestick chart and it has the range we are going to use for the session this evening overlaid in green.
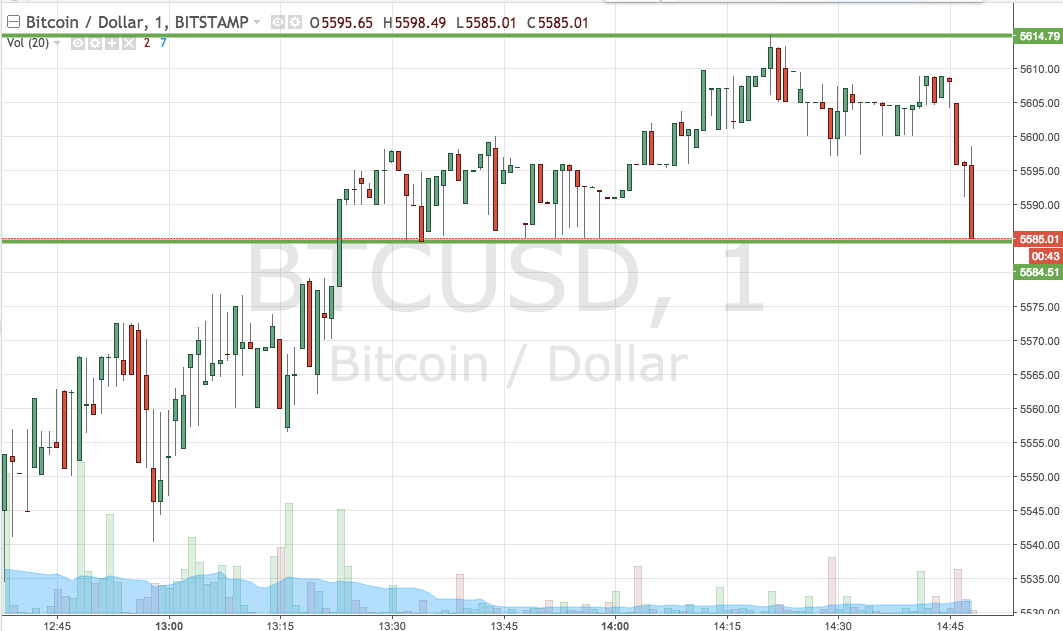

As the chart shows, then, the range we have got in our sights for the session this evening comes in as defined by support to the downside at 5584 and resistance to the upside at 5618. This is a pretty tight range, so we will be using our breakout strategy only for the time being.
Specifically, if we see price break above resistance, we will enter long towards an immediate upside target of 5650. A stop loss on the trade at 5605 looks good.
Looking the other way, if we see price close below support, we will enter short towards an immediate downside target of 5560.
Charts courtesy of Trading View