It has taken a couple of weeks but things are finally getting back on track from a bitcoin price perspective. We had been looking to get the recent correction out-of-the-way and for price to give us the breakout required to underpin a degree of recovery. It now looks as though the recovery is here and the space is breathing something of a sigh of relief as we are seeing key resistance levels broken one after another – a surefire sign that the bulls are taking control of the market.
How long things will remain like this is tough to say, of course, but it looks as though we have weathered the storm, so long as we don’t get another fundamental shock, there needn’t be any immediate cause for concern.
So, let’s get some levels outlined and see if we can put together a strategy to carry forward as and when the markets move. As ever, take a quick look at the chart below before we get started so as to get an idea of where things stand. It is a one-minute candlestick chart that has our range overlaid in red.
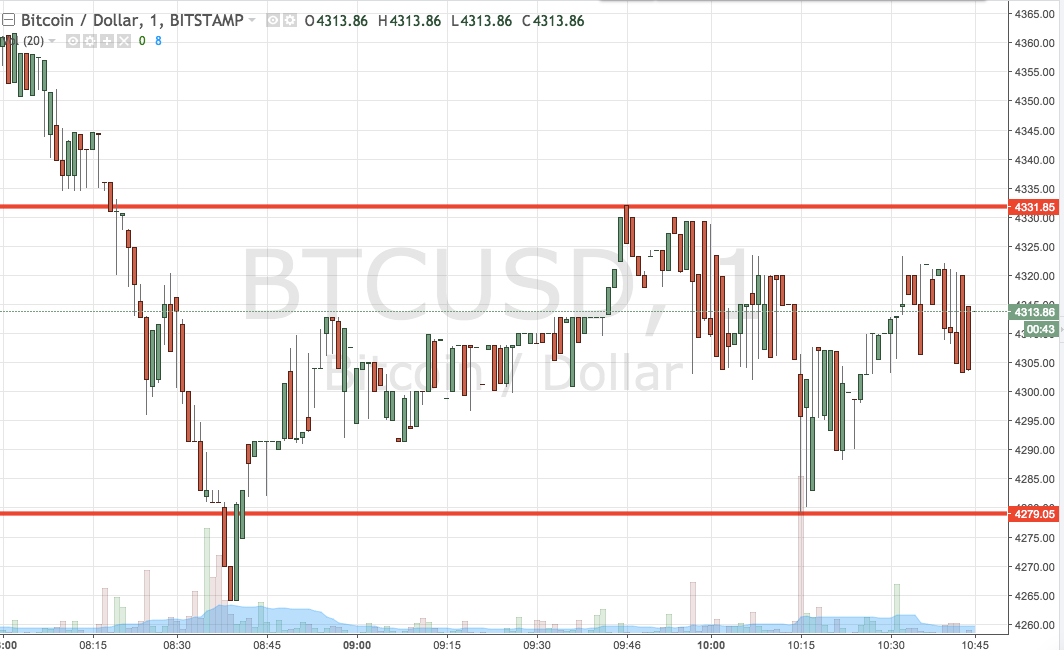

As the chart shows, the range we are looking for the session this evening comes in defined by support to the downside at 4279 and resistance to the upside at 4331. Standard breakout rules apply for the session, so we will look to enter long on a close above resistance towards an immediate upside target of 4400. A stop loss on this one at 4320 defines risk nicely. Looking the other way, if we see a close below support, we will enter a short trade towards a downside target of 4230. Again we need a stop loss and somewhere in the region of 4290 looks like it should do the job.
Charts courtesy of Trading View