Today is a big day for bitcoin. Anybody that caught yesterday’s analysis will know that we highlighted the 5000 mark as a key level to watch going forward. Specifically, we noted that if we saw a break of that level, we would almost certainly see a run towards 5100 and likely beyond based on fact that stop losses were being taken out (in a sort of short squeeze fashion) and that we would see some speculative volume flow towards bitcoin based on an increased media coverage given that a key level has collapsed.
As it turns out, that’s exactly what happened.
Price broke through this level early during the European session and we were ready to jump into a nice long road towards 5100 as and when it happened.
Anyway, we got what should be a pretty interesting session ahead of us, so let’s get some levels in place that we can use to try and draw a profit from the market whatever we see today.
As ever, take a quick look at the chart below before we get started so as to get an idea where things stand and where we are looking to get in and out markets as and when things move during the session. It is a one-minute candlestick chart and it has our key range overlaid in green.
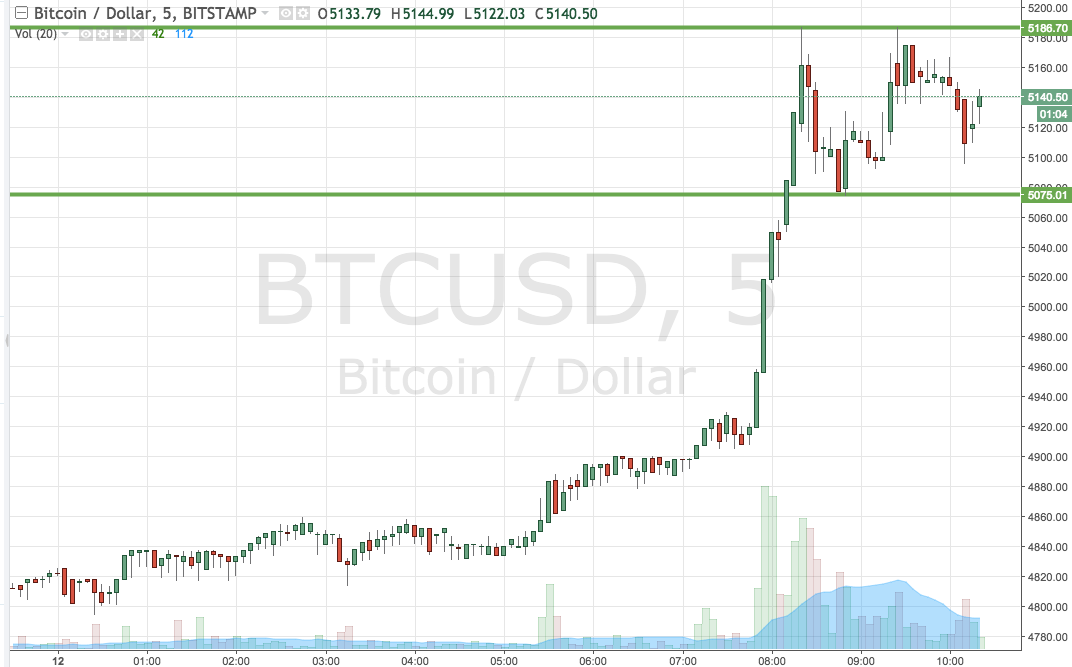

As the chart shows, the range we are looking at for the session today comes in as defined by support to the downside at 5075 and resistance to the upside at 5186.
Our standard breakout rules apply for the session, so we are going to look at getting into the markets long on a close above resistance towards an upside target of 5220. A stop loss on the trade at 5175 looks good.
Looking the other way, if we see a close below support, we will enter short towards a downside target of 5130.
Charts courtesy of Trading View