
Trying to figure out exactly where the bitcoin price is going can be tough work at the best of times. Right now, when things are so uncertain fro a fundamental perspective, it can be almost impossible. Volatility is so prevalent that any external input can translate to real rollercoaster action and this – in turn – can translate to fatal choppiness for the shorter term entries.
That’s why, with our primary intraday strategy, we try our best to keep things flexible. It doesn’t matter if price rises or falls, so long as we are able to jump into the markets as and when we see any breakouts. This flexibility has afforded us some pretty good results against a backdrop of what could be some real tough trading conditions over the past few weeks, and we’re going to keep going with it in the hope that it will continue to do exactly that moving forward.
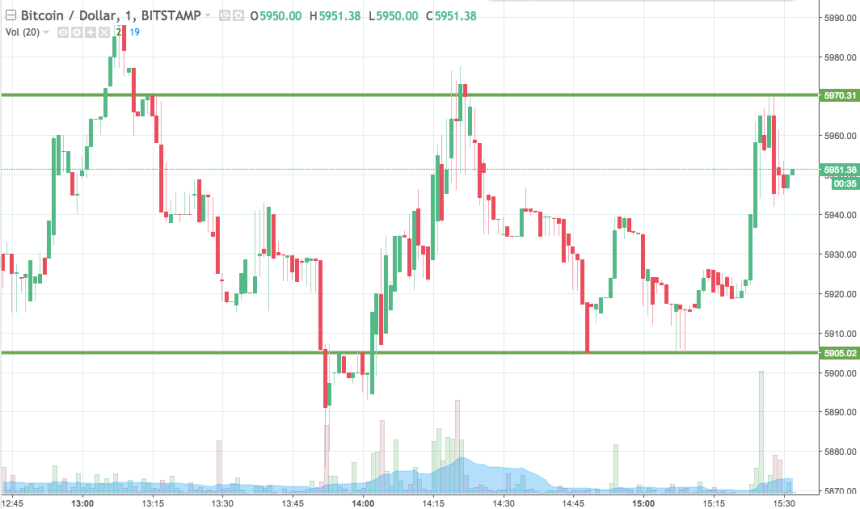
So, with all that said, let’s get some levels in place that we can use to try and draw a profit from the market this evening. As ever, take a quick look at the chart below before we get going on the specifics so as to get an idea what’s on and where things stand. It’s a one minute candlestick chart and it’s got our range overlaid in green.
As the chart shows, then, the range we are looking at for the session this evening comes in as defined by support to the downside at 5905 and resistance to the upside at 5988. We are going to see if we can get into a long trade on a close above resistance, towards an upside target of 6020. Conversely, a close below support will get us in short towards a downside target of 5870.
Stops will define our risk.
Let’s see what happens.
Charts courtesy of Trading View