So we are closing in on the end of another day in our bitcoin price trading efforts and what a ride we have had so far. Things really started to pick up during the early morning session and haven’t really let up since, with price currently trading in and around the $16,000 mark and taking with it a number of the key levels that we outlined this morning as being levels to watch in the sector.
Right now, then, we’ve got to get some levels in place that take all this action into consideration and use it to adapt our strategy to current price action.
So, as we move into the US crossover and, beyond, into the Asian session tonight, here’s a look at what we are focusing on from a bitcoin price perspective and where we intend to jump in to and out of the markets as and when things move. As ever, take a quick look at the chart below before we get started so as to get an idea where things stand. The chart is a one-minute candlestick chart and it’s got our primary range overlaid in green.
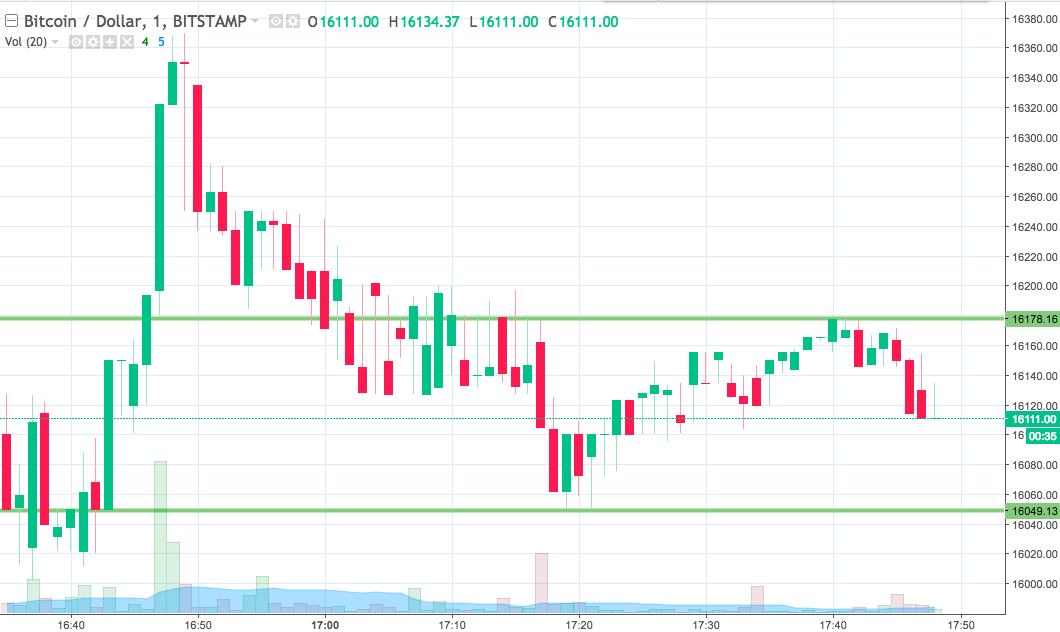

So, as the chart below shows, the range we have in place for the session tonight comes in as defined by support to the downside at 16049 and resistance to the upside at 16178. We will initially look for a close above resistance to validate an immediate upside target of 16250. A stop loss on the position somewhere in the region of 16155 looks good from a risk management perspective.
Looking the other way, if we see a close below support, we’re going to jump into a short entry towards an immediate downside target of 1600. This one’s a little tighter, so a stop at 16060 looks good.
Let’s see what happens.
Charts courtesy of Trading View