We are closing in on the end of the European session on Friday and that means one thing – that the week is almost over. At the end of last week, we saw bitcoin run to an incredible degree as markets loaded up on positions ahead of the introduction of bitcoin futures to the market. We said this morning that we were hoping to see more of the same this week (i.e. a solid run to the upside) and we’ve not got exactly what we wanted.
We have seen some upside, sure, but it’s far from the multi-thousand dollar run we saw heading into last weekend.
Anyway, it’s not overly important. So long as we can stay on top of what’s happening on the intraday charts, we’ll be able to keep things moving for our short-term trades.
So, with all this said, let’s get some levels in place that we can use for the session going forward. As ever, take a quick look at the chart below to get an idea where things stand. It’s a one-minute candlestick chart and it’s got our primary range overlaid in green.
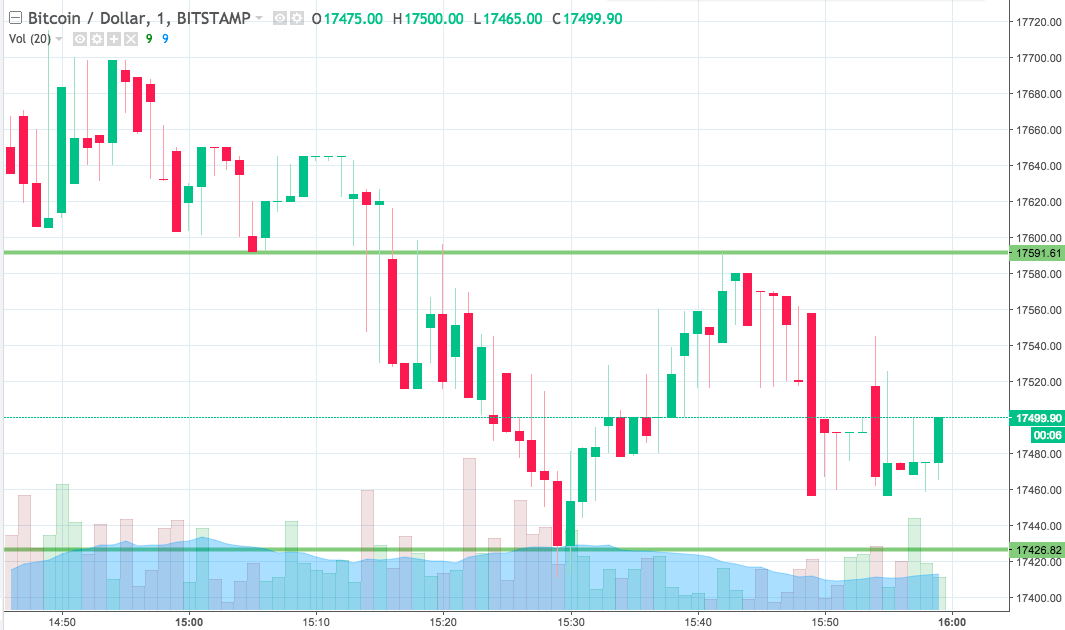

As the chart shows, the range we are looking at for the session today comes in as defined by support to the downside at 17426 and resistance to the upside at 17591. We’re going to go at markets with a couple of different trades tonight, variable depending on how the bitcoin price moves in and around these levels.
So, if we see price close above resistance, we’ll try and jump in long towards an immediate upside target of 17660. A stop at 17575 keeps things tight from a risk management perspective.
Looking the other way, if we see price close below support, we’ll look at jumping in short towards a downside target of 17360.
Let’s see what happens.
Charts courtesy of Trading View