The end of the week is here and it is time to try and get some levels in place that we can use to draw a profit from the market in the bitcoin price during the European session today. Normally, we would take a quick look at what happened overnight so as to inform our key levels moving forward. Right now, however, price is moving pretty fast and if we spend too much time analyzing the action that got us here, we may miss an entry or two.
So, with that in mind, let’s just get straight into the action and get our key levels in place. As ever, take a quick look at the chart below before we get started so as to get an idea where things stand and where we are looking to jump in and out of the markets according to the rules of our intraday strategy. It is a one-minute candlestick chart that has our key range (the range that we are going to use to define our entries) overlaid in green.
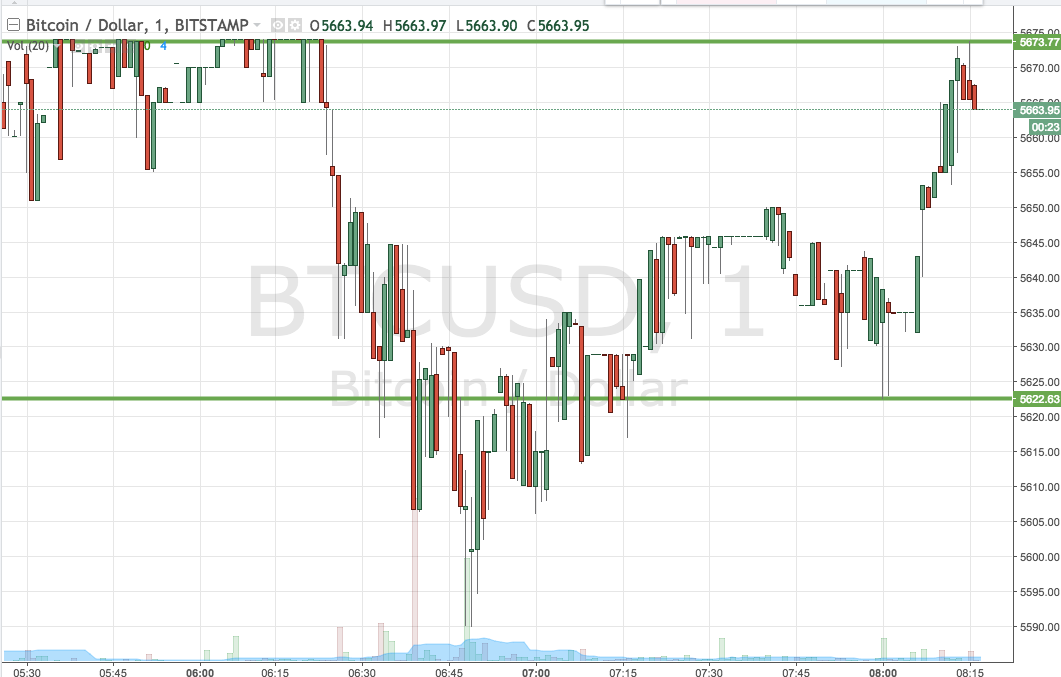

As the chart shows, then, the range we are going to use for the session today comes in as defined by support to the downside at 5622 and resistance to the upside at 5677. We’re going to stick with our breakout strategy for the time being, purely because price is moving pretty fast and intrarange doesn’t leave us enough room for our risk management parameters under these conditions.
So, our first trade will be based on a close above resistance, at which point we will enter long towards an immediate upside target of 5720. We need a stop loss to define risk and somewhere in the region of 5655 looks like it should work nicely.
Looking the other way, if we get a close below support, we will enter short towards a downside target of 5600. A stop on this one at 5670 works well.
Charts courtesy of Trading View