Let’s kick things off with a chart. The chart below shows the action we saw in the bitcoin price overnight, and the action that has taken place since we published the first of our twice daily bitcoin price watch articles this morning. It’s got the framework we applied to our first analysis still overlaid, to illustrate how action has performed in relation to our expectations.
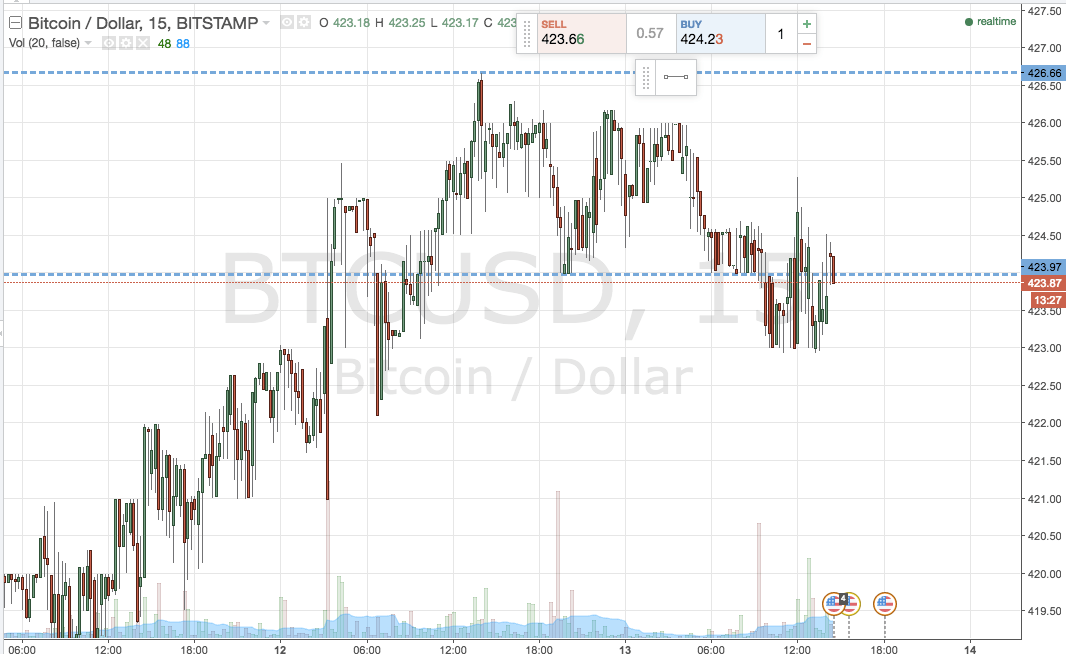

Those that were with us this morning will remember we focused on the double top pattern that formed overnight, and the implications this might have for a near term bias going forward. Specifically, that this pattern might suggest we are in for some medium term bearish action, as the overarching up run seen over the past forty-eight hours corrects and consolidates.
As the chart above shows, we did see some bearish action, and the breaking of the neck line put us short towards a downside target of 419. Before we reached this price, the bitcoin price reversed, and temporarily traded within range. We narrowly missed a stop take out, and have since reversed again to resume the downside action. As such, we remain short towards 419.
That’s the live trade out of the way, what about action and key levels for tonight’s Asian session, and the upcoming US afternoon? For this, take a quick look at the chart below. It’s the same as the previous, but with some altered levels to reflect today’s movement.
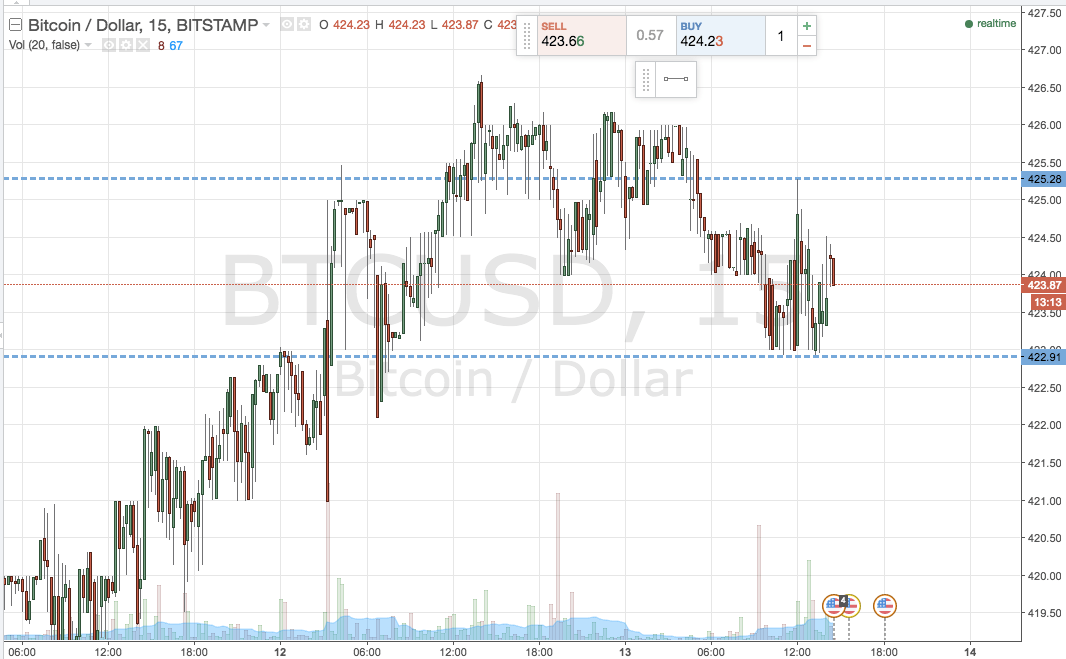

As the chart shows, we’ve shifted our range to the downside, and it’s now defined by in term support at 423 flat and in term resistance at 425.28.
If we see the bitcoin price close above resistance, we’ll look to enter long towards 430 flat. A stop on this one somewhere around 423 flat defines risk nicely.
Looking short, a close below 423 will signal a downside position towards 417. Stop at 424 to define the trade’s risk.
Charts courtesy of Trading View