The bitcoin price is currently midway through a correction early morning out of Europe and in an attempt to capitalize on this correction from an entry point of view, we’re going to jump straight into our analysis.
So, take a look at the chart below before we get started. It is a one-minute candlestick chart and it has our range overlaid in green.
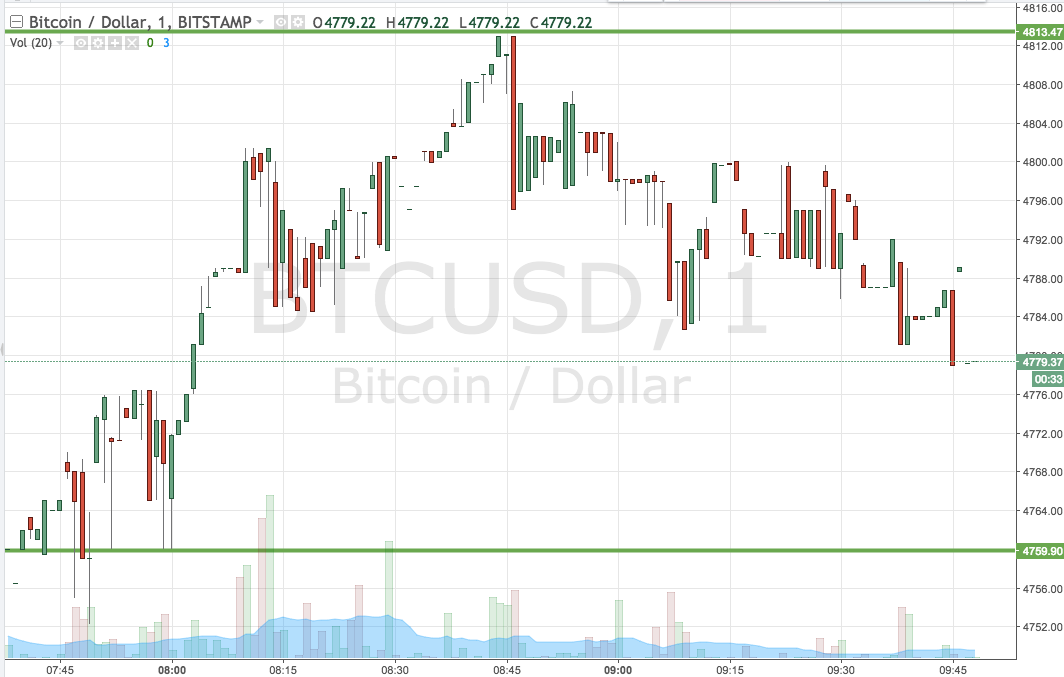

As the chart shows, the range we are looking at for the session today comes in as defined by support to the downside at 4759 and resistance to the upside at 4813. We are jumping into our analysis like this because we want to set up the potential for an intrarange approach on top of our standard breakout approach and if we wait too long before setting up our key levels we may miss an intrarange entry. So, if we see price bounce from support (towards which it is currently heading) we will jump into a long trade towards an upside target of resistance. Keep in mind that a bounce constitutes price not closing below support and covering subsequent to touching it. Again, and conversely, if we see price run up to resistance and correct from that level, we will enter short towards a downside target of support.
So that is our intrarange approach outlined. What about our breakout strategy?
This one is relatively simple.
If we get a close above resistance, we will enter long towards an upside target of 4850. A stop loss on the trade somewhere in the region of 4805 will keep things tight from a risk management perspective.
Looking the other way, a close below support will signal a short entry towards a downside target of 4720. On this one, a stop loss somewhere in the region of 4770 looks good.
Let’s see how things play out and we will update later on.
Charts courtesy of Trading View