So that’s another day done out of Europe, and it’s time to take the second of our twice daily looks at the bitcoin price this evening. A look at the session for today reveals one thing: it’s been a bit dull. Some days, action is flat and we don’t manage to get in to any real breakout entries. Some days, we manage to get into an entry, but it’s a quick turnaround, and we don’t see anything else outside of that position materialize for the remainder of the day. Today was the latter of these two scenarios. With that said, a profit is a profit, so we shouldn’t really be complaining.
We’d like to see a bit more solid action this evening, however, just to mix things up a bit. So, with that noted, let’s outline some fresh levels, and see if we can’t pull a profit from the market.
As ever, take a quick look at the chart below before we get started, and then we’ll get in to the detail.
It’s a five-minute candlestick chart with about twelve hours’ worth of action displayed, and it’s got our key levels overlaid in green.
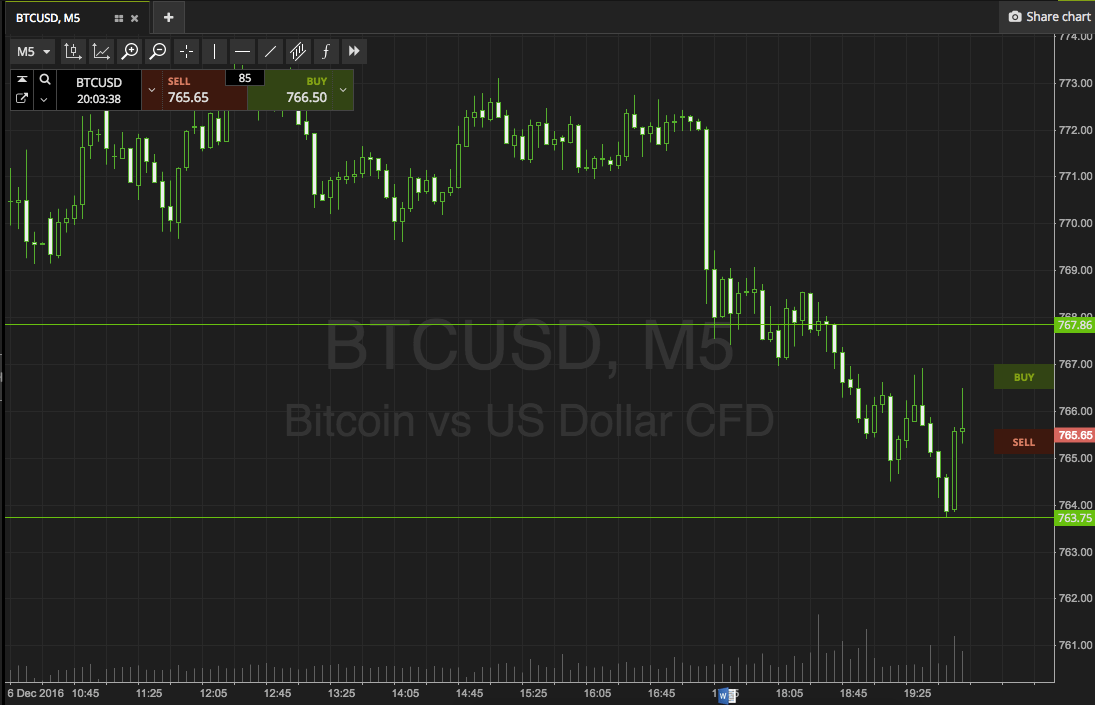

As the chart shows, the range we are looking at is defined by in term support to the downside at 763 flat, and in term resistance to the upside at 767.
We will initially look for a reversal of the current action, and some bullish momentum, to break above, and close above, resistance. If we get this break, we’ll get in long towards an immediate upside target of 775. A stop loss on this position somewhere in the region of 765 works to keep risk pretty tight.
Looking the other way, a close below support will signal a short entry with a downside target of 755. A stop on this one at 765 looks good.
Charts courtesy of SimpleFX