Wow, what a night. We’ve been asking for some volatility in the bitcoin price for the last couple of days, and boy did we get it last night. Things we’re a little flat in to yesterday evening, and we noted in the second analysis of the day that we may see a sharp breakout based on the idea that the flat action heading into the late session was a sort of price coiling. Price coiling is a conceptual way to describe the pressure building between buyers and sellers in the (generally speculative side of the) market, and when one side of the equation picks up a little extra strength, we pretty much always see a sharp breakout and a sustained move in the direction of the break.
It’s these sorts of moves that our breakout scalp strategy was born to play – quick entries, follow the momentum through to a solid take profit and out.
Anyway, that was last night, now we’ve got a whole load of mess to contend with.
Price is settling, but we don’t know whether it’s coiling again or whether this action is purely corrective. We’ll soon see, but we’ve had to tighten our charts right in to get a real play on things.
With this in mind, take a look at the chart below to get an idea of what’s on. It’s an intraday 1-minute chart with our range overlaid.
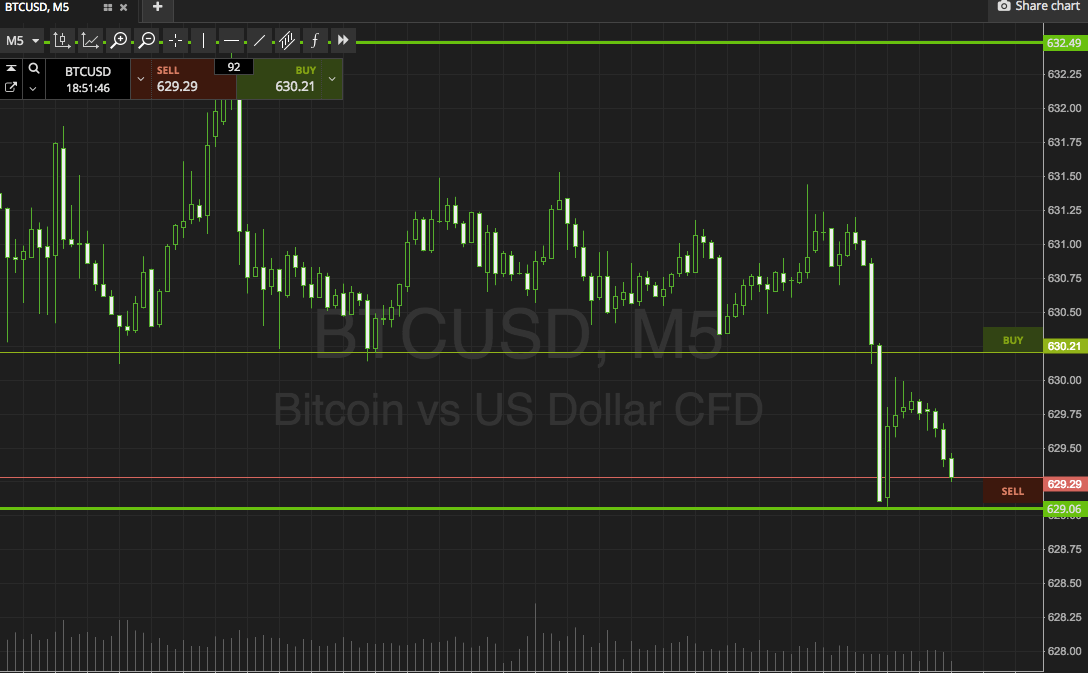

As the chart shows, we are looking at in term support to the downside at 667 flat, and in term resistance to the upside at 671.
If we see price break below the former, we are going to look at getting in short towards an immediate downside target of 660 flat. Conversely, if price closes above resistance, we will enter a long position towards 676.
Happy trading!
Charts courtesy of SimpleFX