Anybody found themselves holding bitcoin over the last few days is undoubtedly having a pretty great close to the week. Things have moved incredibly far and high in just a few short hours in the bitcoin price and, across some of the most well-known exchanges, bitcoin broke $15,000 apiece overnight last night.
It’s time for us to put some levels together that we can try and use to draw a profit from the market on an intraday basis right now so we’re going to jump straight into it so as to avoid missing out on any of the volatility that is coming at us thick and fast currently.
As ever, then, take a quick look at the chart below before we get started so as to get an idea what happened overnight and where things stand as we head into the European session this morning. The chart is a one-minute candlestick chart and it has our primary range overlaid in green.
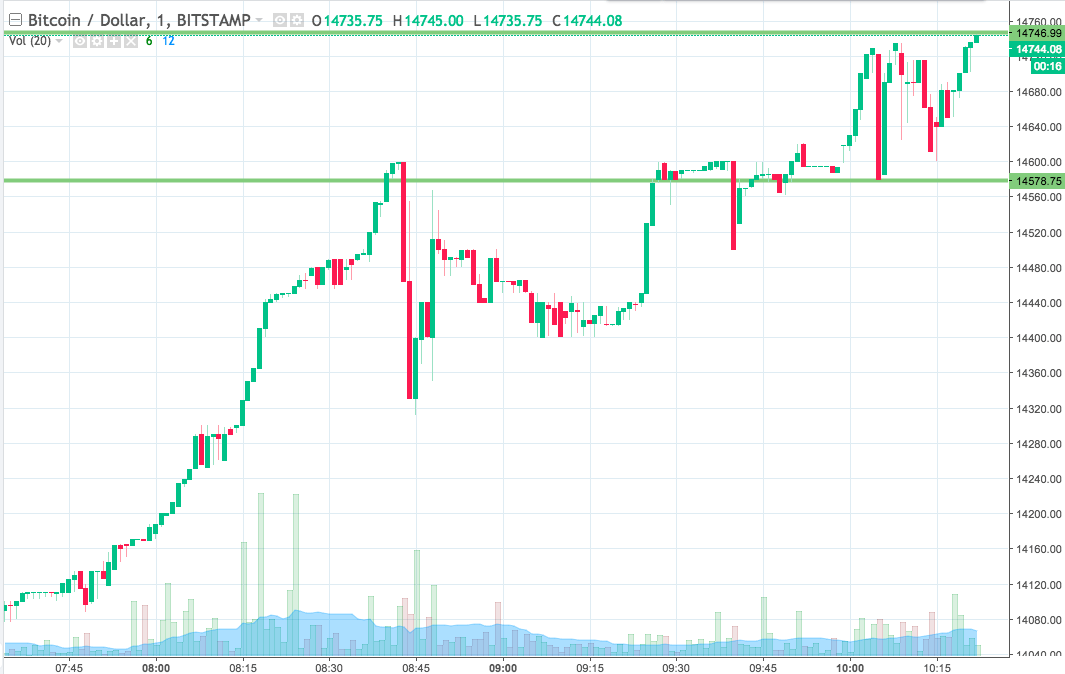

As the chart shows, the range that we are using for the session today comes in as defined by support to the downside at 14578 and resistance to the upside at 14746. This is a pretty wide range, so intrarange trading is an option as things stand. Specifically, long on a bounce from support towards a target of resistance and, conversely, short on a correction from resistance towards a target of support.
Looking at things from a breakout perspective, if we see price close above resistance, we will enter long towards an immediate upside target of 14800. A stop loss on the trade at 14730 defines risk nicely.
Looking the other way, if price closes below support, it will signal a downside trade with an immediate short target of 14510. Again we need a stop loss on the position and somewhere in the region of 14600 looks like it should do the trick.
Let’s see how things play out.
Charts courtesy of Trading View