The European session is coming to a close and it’s time to take the second of our twice-daily looks at what’s happening on the narrow timeframe charts in the bitcoin price. Action throughout the session today fell pretty much in line with our expectations as outlined in this morning’s coverage. Specifically, we noted that we would likely see a breakout of the consolidation that dominated overnight and that – if we did get a breakout of this type – we could enter in line with some pretty substantial momentum.
With any luck, we will see a continuation of this upside momentum overnight on Thursday and – further – as we head into the weekend. So, with this in mind, let’s get some levels in place with which we can attempt to draw a profit in the market whether we get the type of action we are looking for or not. As ever, take a quick look at the chart below before we get started. It is a one-minute candlestick chart and it has our range overlaid in red.
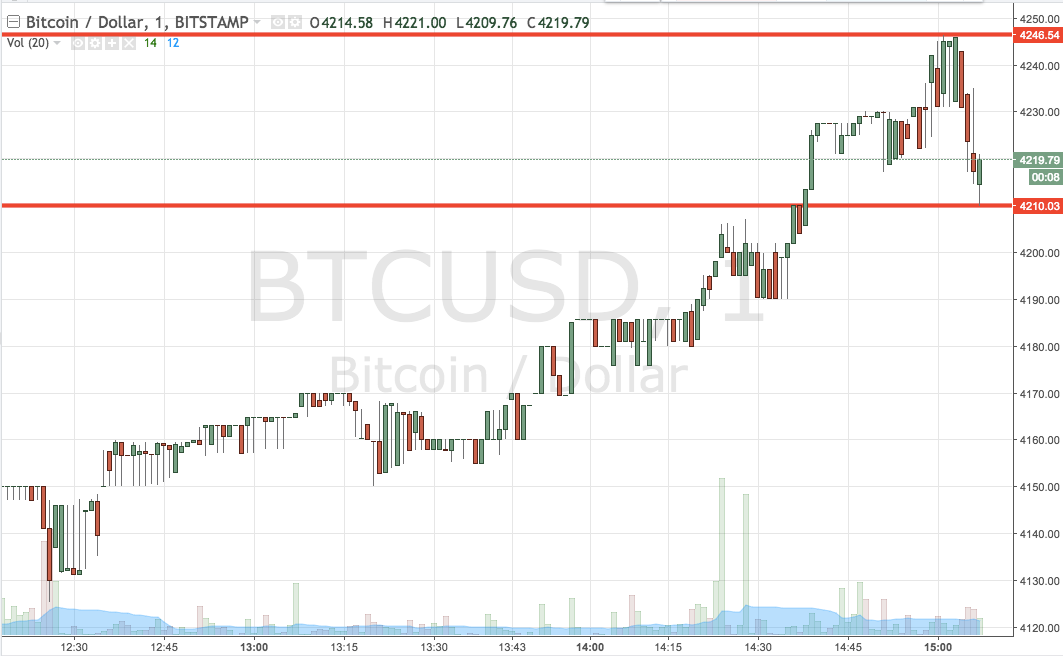

As the chart shows, the range we’re looking at for the session this evening comes in as defined by support to the downside at 4210 and resistance to the upside at 4246. We are going to address the upside trade first as this is in line with the overarching momentum. So, if we see a break above resistance, we will enter long towards an immediate upside target of 4270. A stop loss on the trade around 4236 works to define risk.
Looking the other way, if we get a close below support, we will jump in short towards a downside target of 4190. On this one, a stop loss somewhere in the region of 4215 will ensure we are taken out of the position in the event of a bias reversal.
Chart courtesy of Trading View