So we are now closing in on the end of the day in Europe and it’s time to take a look at how action matured throughout the day in the bitcoin price today and – in turn – to put forward a strategy that we can incorporate into our operations in an attempt to pull a profit from the market on any volatility.
As ever, before we get started, take a quick look at the chart below so as to get an idea where things stand and where we are looking to jump in and out of the markets as and when things move. The chart is a one-minute candlestick chart and it’s got our primary range overlaid in green.
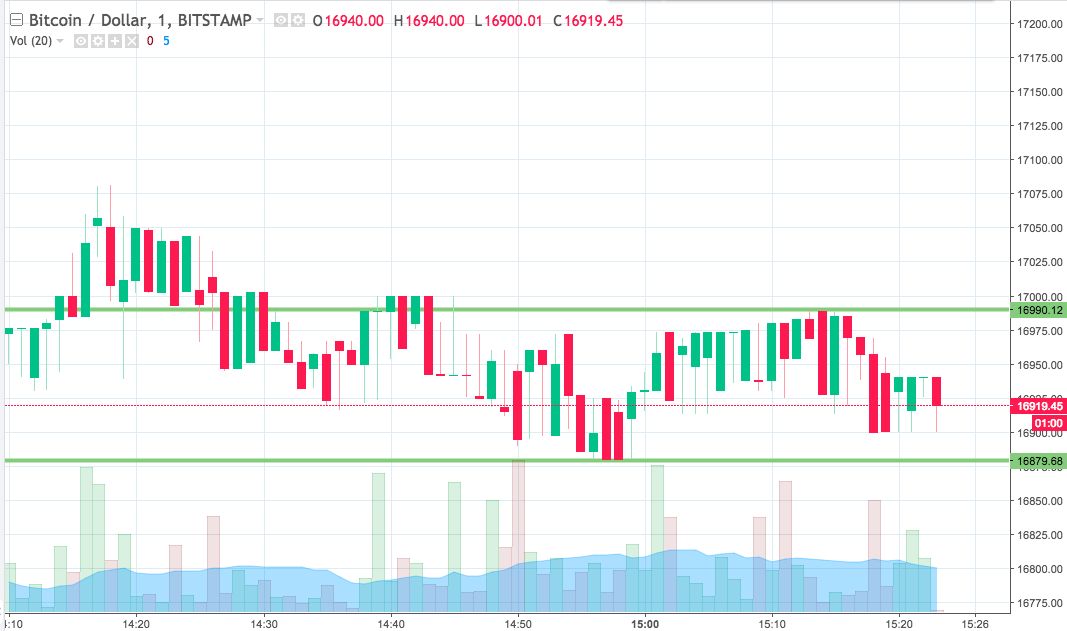

As the chart shows, the range we are going to be using for the session this evening comes in as defined by support to the downside at 16879 and resistance to the upside at 16990. We are going to stick with our standard breakout approach for the time being and if this changes we will update accordingly. The only reason it would change is if we saw a substantial breakout followed by some corrective (and, subsequently, consolidation) conditions so, realistically, we may be looking at tomorrow morning before any of that sort of action hits the tape.
Anyway, let’s get back to the present.
We’ve outlined our range so let’s look at the entry points.
If we see price break through resistance (so, to the upside), we will look to enter long on a close above that level towards an immediate upside target of 17050. A stop loss on the trade somewhere in the region of 16975 looks good from a risk management perspective.
Looking the other way, if we get a close below support, we’ll jump in to a short trade towards an immediate target of 16820.
Let’s see what happens.
Charts courtesy of Trading View