Things just got interesting once again in the bitcoin price. Earlier this morning, we noted that we might be in for a short period of consolidation as the action overnight settled down and markets rebalanced ahead of a fresh day of trading in the space. We did get some consolidation, but it didn’t last half as long as we thought it might price really started to take off shortly before lunchtime out of Europe and – throughout the European afternoon – hasn’t really stopped to look back.
We saw a break of 5700 within the last hour and it’s now looking like we are going to see some more psychologically significant levels taken out as we head into the crossover session out of the US near term.
So, in anticipation of us seeing this sort of action materialize as things mature, here’s a look at what we are going for in the bitcoin price and where we intend to jump in and out of the markets according to the rules of our intraday strategy.
As ever, take a quick look at the chart below before we get started so as to get an idea where things stand and where we are looking to enter as price matures.
It’s a one-minute candlestick chart and it’s got our key range overlaid in green.
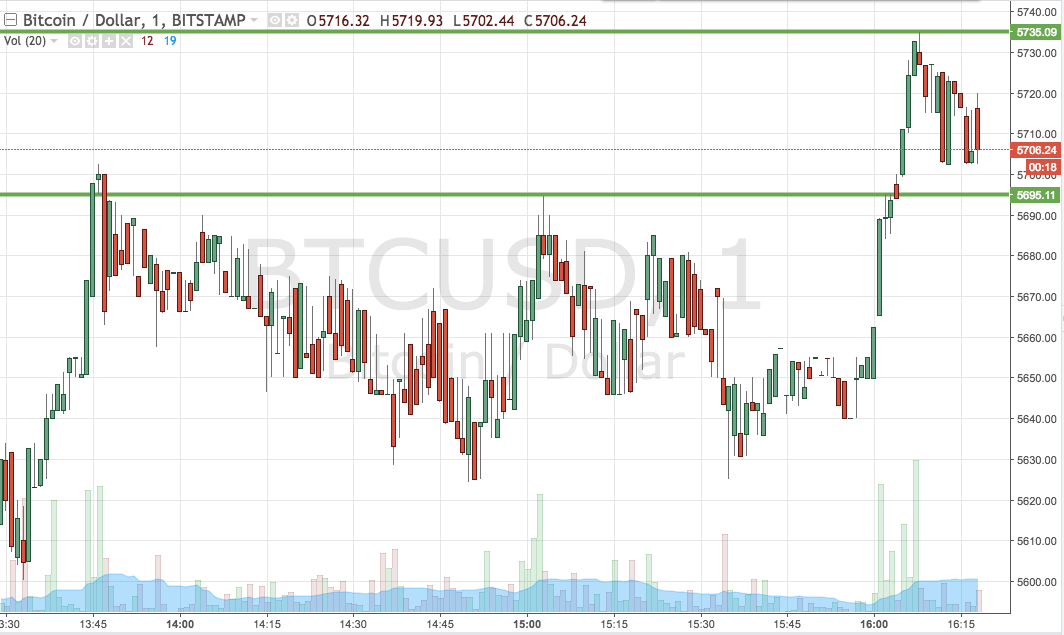

As the chart shows, then, the range we are looking at for the session today comes in as defined by support to the downside at 5695 and resistance to the upside at 5735. We are going to look for an initial trade as dictated by a close above resistance, at which point we will enter long towards a target of 5770. Conversely, if we see a close below support, we’re going to jump into a short trade towards a downside target of 5650.
Let’s see how things play out.
Charts courtesy of Trading View